
At 05:48 UTC on 19 September, Guillermo Rauch posted a number from the Vercel AI Gateway: open models at 78.4% of token volume, closed at 21.6%, with the note that spend "usually tells a different story" and that Moonshot, DeepSeek and Z.ai together now out spend OpenAI on his platform. By our snapshot three days later the post had 2,510 likes and 2.67 million impressions. Polymarket reposted the headline figure to two million followers the next night, and our tracker logged 89 X and Reddit posts from 76 distinct authors repeating the 78.4% between 19 and 22 September. Two sentences deep in most of those reposts, the spend caveat had disappeared.
Then the pushback. Dax Raad, who runs an inference company and has 172,000 followers, called the whole genre "complete nonsense": routers share percentages instead of absolute numbers so they look bigger than they are, and "no router has any real reason to see 99% of frontier traffic." That post did 790 likes and 63,000 impressions, and he is not wrong about the selection effect.
We run a gateway too, so we are in the population he is describing. Rather than add another percentage to the pile, this post splits the same traffic three ways and shows where each cut misleads.
Three numbers for the same traffic
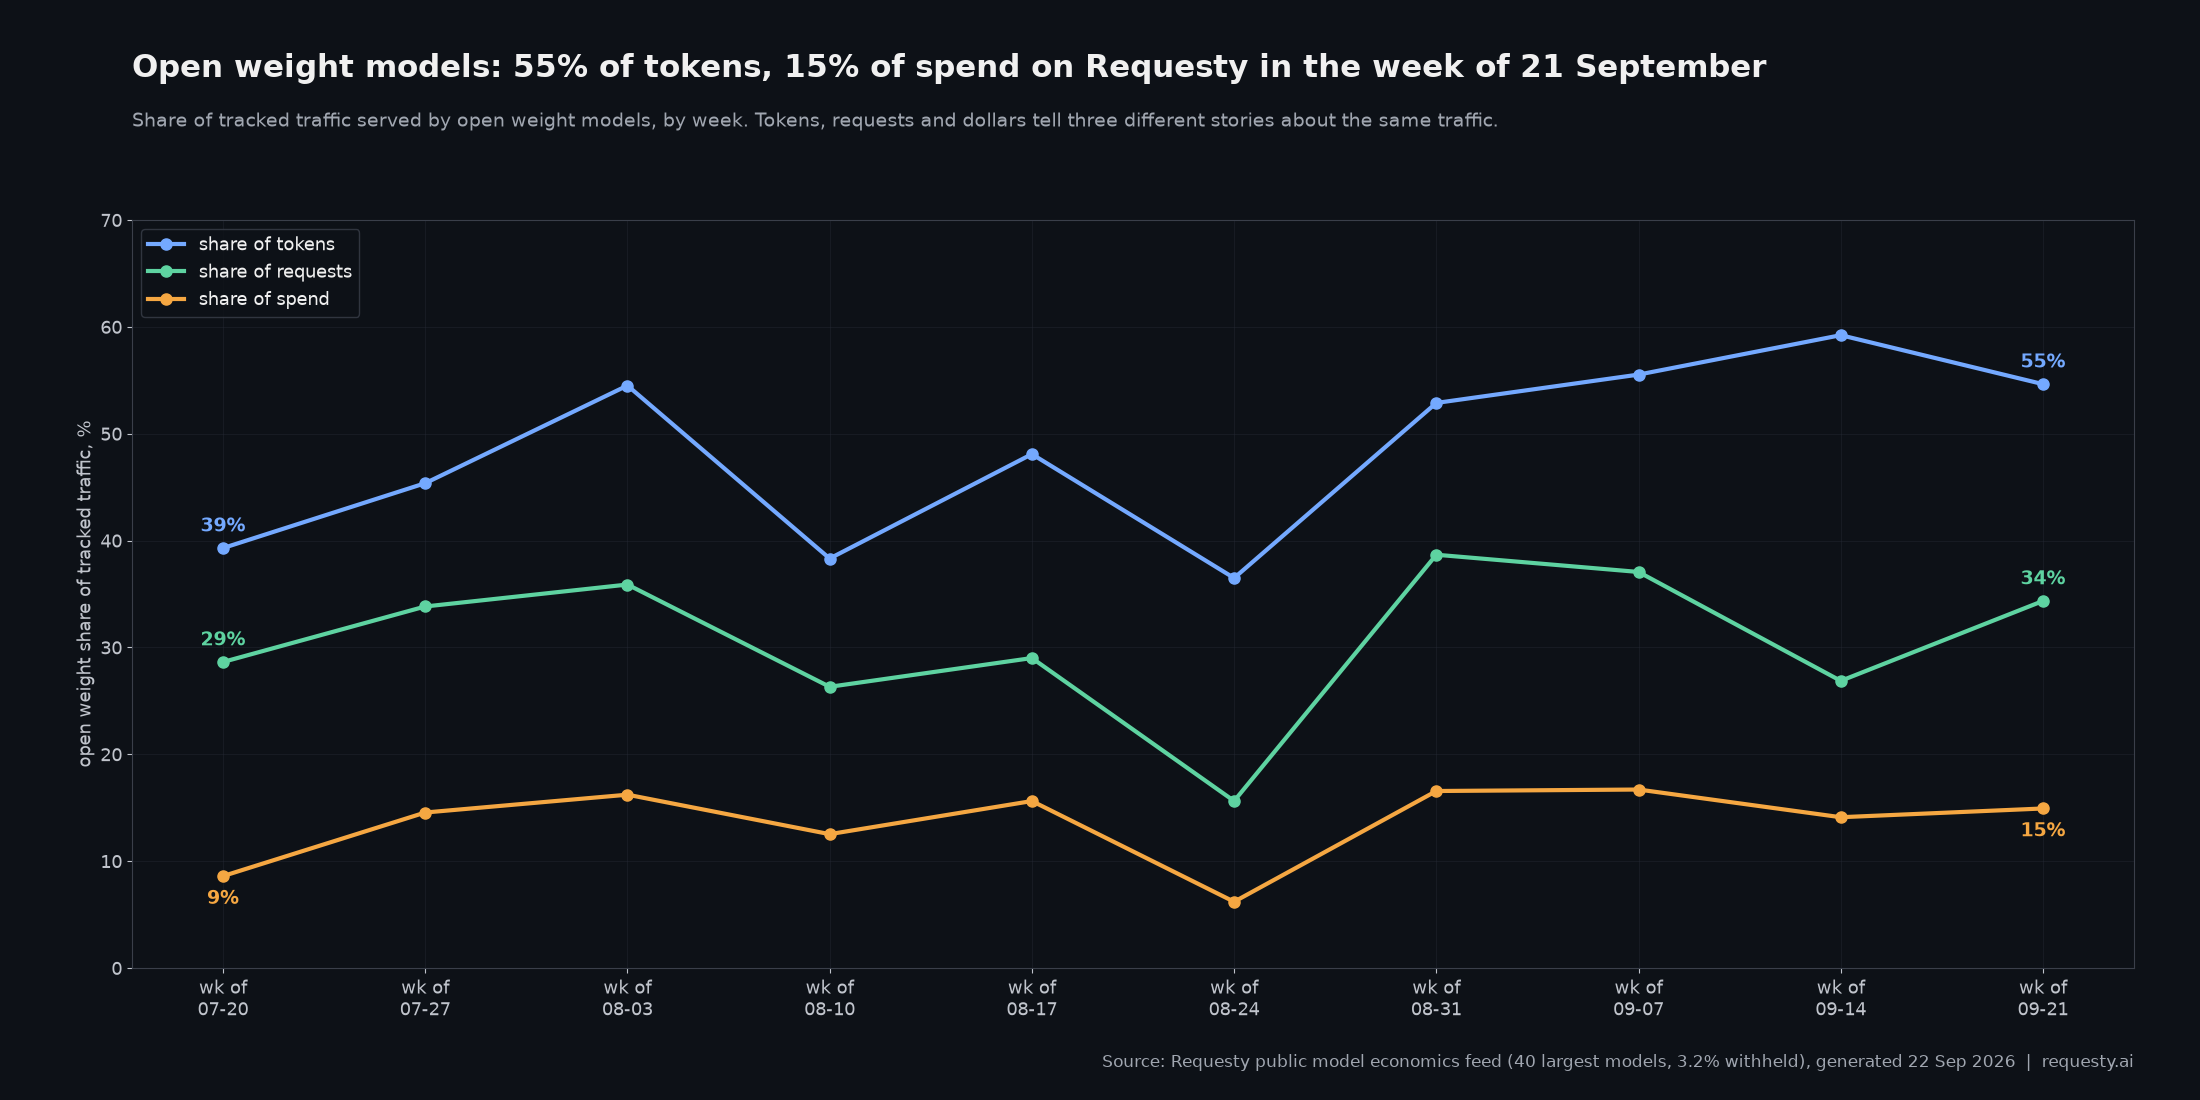
Requesty publishes a model economics feed covering the 40 largest models on the platform (3.2% of traffic is withheld for customer confidentiality). For the week of 21 September, the open weight models in that table account for:
- 54.6% of tokens
- 34.3% of requests
- 14.9% of spend
Ten weeks earlier, in the week of 20 July, those figures were 39.3%, 28.6% and 8.6%. Every line has moved up, and the ordering has never changed: tokens first, requests second, dollars a distant third.
The 40 point gap between the token share and the spend share is not a rounding artifact. It is the price list. Dividing spend share by token share gives an index of cost per token, and for the open weight group it lands at roughly $0.17 per million blended tokens after caching, against roughly $1.20 for the closed models in the same table. Seven to one. A model that costs one seventh as much has to serve seven times the tokens to show up equally on the invoice, and the workloads that pick a seven times cheaper model are agent loops that read the same files, tool results and system prompts over and over. Cheap models attract the token heavy work by construction.
The request share sits in between because it measures something different again: how often a developer reaches for the model at all. A third of calls going to open weights is the number that best describes adoption. The token share describes where the volume lives. The spend share describes who is getting paid.
Where the money still goes
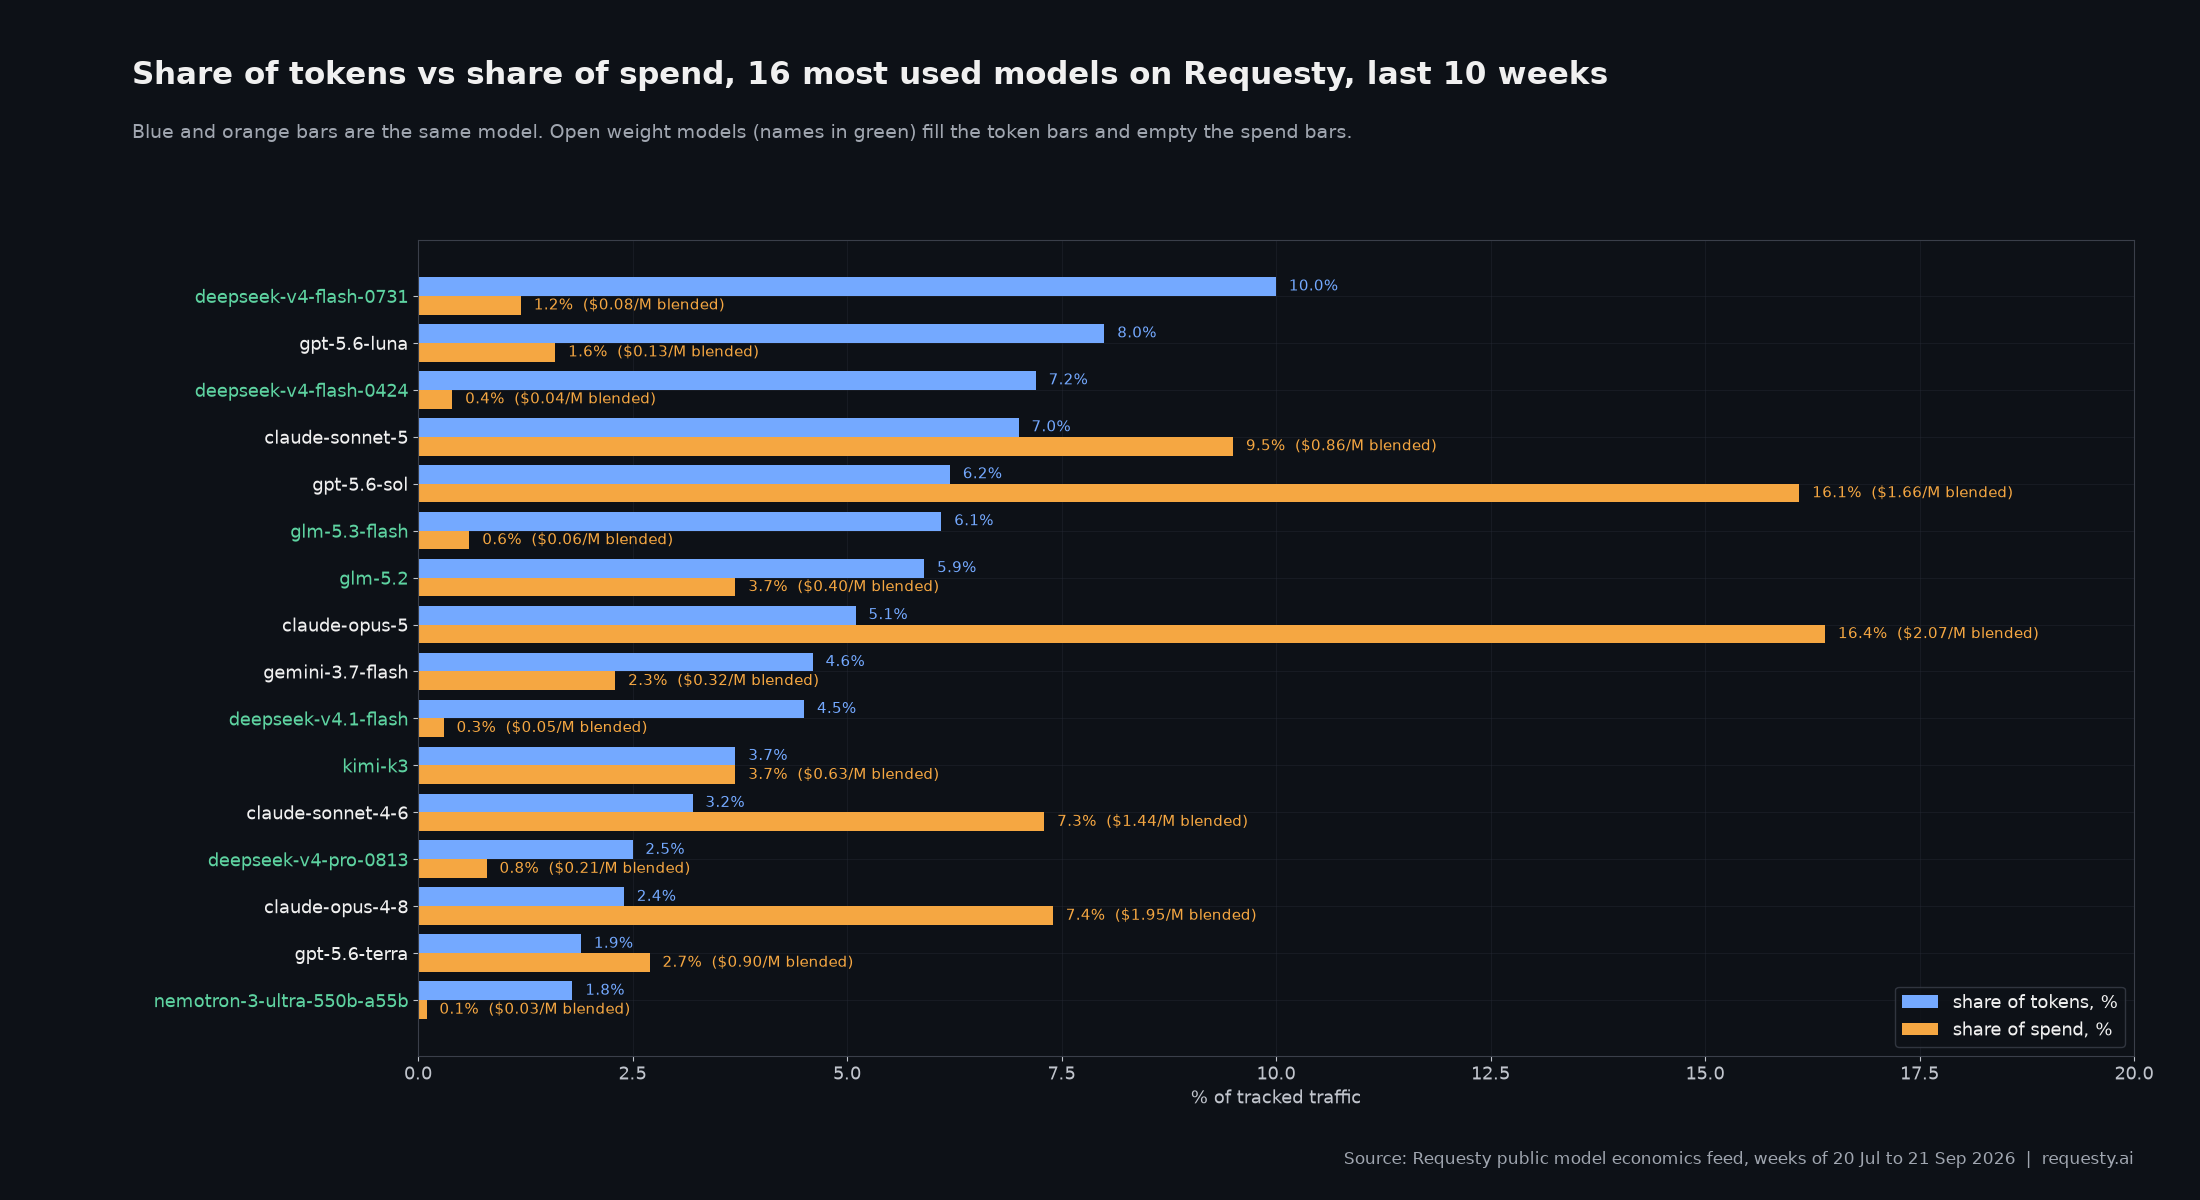
Per model over the ten weeks, the pattern is stark. DeepSeek V4 Flash 0731 is the most used model on the platform by tokens at 10.0%, and it produces 1.2% of spend at a blended $0.08 per million. Claude Opus 5 is eighth by tokens at 5.1% and first by spend at 16.4%, at $2.07 per million blended. GPT-5.6 Sol is the same story: 6.2% of tokens, 16.1% of spend. Two closed models on a combined 11% of tokens collect 32.5% of the dollars.
The one open weight model that breaks the pattern is Kimi K3, at 3.7% of tokens and 3.7% of spend. It lists at $3 in and $15 out on every host, which is frontier pricing, and it behaves like a frontier model on the invoice. Open weights do not make a model cheap. Competition between hosts does, and Kimi K3 has not attracted the price war that DeepSeek and GLM did.
This is why we think the "open models are winning" framing and the "routers exaggerate" framing are both half right. Open weight models have won the token count decisively on every gateway that publishes data. They have not won the revenue, and on our platform the closed labs still collect roughly 85 cents of every dollar. Both facts sit in the same table.
What gateway data cannot see
Dax Raad's second point deserves a straight answer. Gateway traffic is self selected. A team that puts a routing layer between its application and the providers has already decided it wants to compare models, switch on price, or fail over between hosts. That population adopts open weights faster than a team that signed an enterprise agreement with one lab and calls its API directly. Direct first party traffic to OpenAI and Anthropic, which is most of their revenue, is invisible to Vercel, to OpenRouter and to us.
So the honest reading of 78.4%, or of our 54.6%, is: among developers who are actively shopping, this is where the tokens go. It is a leading indicator for the price sensitive part of the market, not a census. The OpenRouter public leaderboard that an enterprise analyst read as DeepSeek first and the top Anthropic model seventeenth is the same kind of evidence, with the same caveat.
One more caveat that applies to everyone, including us: token share is inflated by verbosity. A model that reasons at length or repeats tool output produces more tokens for the same task. Artificial Analysis found that Grok 4.7 generated 240 million tokens to complete its Intelligence Index where the median model needs 94 million, and we cover what that does to price in our Grok 4.7 and MiMo-V2.6 comparison. Tokens are an input cost, not a measure of work done. Cost per task is the metric that survives this.
The number that matters to a builder
Yuchen Jin, who runs an inference platform, put the practical version in one post that reached 229,000 impressions and 2,100 likes: frontier coding capability has plateaued since Opus 4.8, open weight models keep closing the gap "while costing 10x to 50x less", and that is why enterprises are shifting. Whether or not you accept the plateau claim, the price gap is measurable and the table above measures it.
If open weight models can do a job at one seventh the blended price, the question for a production team is not "open or closed" but which requests can move. In our traffic the answer has been most of the token volume and a third of the requests, with the frontier models kept for the calls that need them. Getting there takes three things:
- An eval harness of your own, so you know which of your prompts a $0.08 model handles and which still need the $2 one. Public leaderboards will not tell you; a private harness will.
- A routing layer that can send each request to the right model without an application change. On Requesty that is a managed policy with fallback policies behind it, so a DeepSeek outage falls back to another host of the same weights rather than to a model five times the price.
- Visibility into spend per model, per key and per team, because the seven to one ratio only saves money if you can see it. Usage analytics and spend alerts exist for this.
The cheapest models ranking shows the current price floor across hosts, and the pricing comparison walks through what caching does to a blended rate. If you want to see your own three numbers, sign up and route a week of traffic; the dashboard splits it exactly this way.
Methodology and caveats
All Requesty figures come from the public model economics feed generated on 22 September 2026, covering weeks of 20 July to 21 September. Shares are computed across the 40 largest models only; 3.2% of traffic is withheld. "Open weight" follows the feed's own flag. Blended cost per million is after caching, which matters: the platform wide cache hit rate is 78.3%, and the open weight Flash tier models run between 81% and 96%. The $0.17 and $1.20 blended figures are derived by applying each group's spend to token ratio to the platform blended rate of $0.64 per million, so they are estimates to within a few cents, not invoice lines.
Social figures come from our public post tracker, which polls X and Reddit for gateway and model related conversation every ten minutes. Engagement counts for quoted posts were refetched from the X API on 22 September, at least twelve hours after each post, so they are mature rather than launch minute numbers. The 89 post count for the 78.4% story is a lower bound; it counts posts that quote the figure or describe the Vercel open weight token share, not every reply in those threads.
Frequently asked questions
- What share of LLM traffic goes to open weight models in 2026?
- It depends on what you count. On the Requesty gateway in the week of 21 September 2026, open weight models served 54.6% of tokens, 34.3% of requests and 14.9% of spend among the 40 largest models. Vercel reported 78.4% of AI Gateway token volume on 19 September. Token share is the most flattering metric for open weights because the cheapest models attract the longest, most repetitive agent loops.
- Why is spend share so much lower than token share for open weight models?
- Price. The blended cost of the open weight models in our top 40 works out to roughly $0.17 per million tokens after caching, against roughly $1.20 for the closed models in the same table, about a seven to one gap. A model that is seven times cheaper per token needs seven times the tokens to reach the same spend share, and the agent workloads that pick cheap models are exactly the ones that burn tokens on tool output and repeated context.
- Is gateway data representative of the whole LLM market?
- No, and nobody should claim it is. Gateways see traffic from teams that already want to compare providers, which selects for price sensitivity and for open weight adoption. Direct first party API traffic to OpenAI and Anthropic is invisible to every gateway. Treat gateway shares as a leading indicator of where price sensitive builders are going, not as a market census.
- Which open weight models carry the most traffic on Requesty?
- Over the ten weeks to 21 September: DeepSeek V4 Flash 0731 (10.0% of tokens, 1.2% of spend), DeepSeek V4 Flash 0424 (7.2%, 0.4%), GLM-5.3 Flash (6.1%, 0.6%), GLM-5.2 (5.9%, 3.7%), DeepSeek V4.1 Flash (4.5%, 0.3%) and Kimi K3 (3.7%, 3.7%). Kimi K3 is the only open weight model in the top 16 whose spend share matches its token share, because it is priced like a frontier model.
- JUL '26
No model stays #1: the leader's share of gateway traffic fell from 29% to 8% in eight months
The model wars do not have a winner. They have churn. The single most used model held 29% of traffic last November. By June the leader held just 8%, and the crown changed hands almost every month.
- AUG '26
Five open weight releases in nine days: GLM-5.3-Flash, Qwen3.8-Flash, Hy4 and the collapse of the capability premium
Between 20 and 28 August, Z.ai, Alibaba, Tencent, MiniMax and DeepSeek all shipped open weight models with 1M token context windows at Flash tier prices. Model launch chatter in our corpus more than doubled week over week. The frontier did not move much. The price of reaching it collapsed.
- AUG '26
36x the price for 22% more quality: the Pareto data that should decide your model mix
Glean benchmarked 37 models and reasoning configurations across 1,000 enterprise tasks. The gap between the cheapest and the priciest frontier model was 36x on price and 22% on quality. Add an 11x provider spread and a 2x reasoning effort penalty on the same model, and single model deployments start to look like the most expensive decision in the stack.
- SEP '26
The same benchmark suite costs $0.05 on one model and $3.69 on another: stop comparing price per token
Artificial Analysis publishes the measured cost of running its evaluation suite on each model. On the 2026-09-03 snapshot the spread is 76x, and the ranking does not match the per token price list.
- SEP '26
Grok 4.7 and MiMo-V2.6 Pro launched four hours apart with the same benchmark score: one costs a fifth per token and a twenty fourth per eval
SpaceXAI shipped Grok 4.7 at 16:17 UTC on 21 September and the announcement did 12.3 million impressions. Xiaomi shipped MiMo-V2.6 Pro and Flash four hours later and took the evening. Artificial Analysis scores both flagships 46 on its Intelligence Index. Grok 4.7 lists at $2 in and $6 out; MiMo-V2.6 Pro at $0.435 and $0.87. Running the same benchmark cost $4,967 on one and $207 on the other. Here is why the gap is bigger than the price list says.
- SEP '26
Jev, week two: 1,316 posts, four gateways giving it away, and an open weight clone trained on one GPU
TypeSafe's decision model launched on 15 September. By 22 September our tracker had 1,316 posts from 965 authors, the daily count had plateaued near 280, Vercel and Lovable had both made it free for a week, OpenRouter had benchmarked it at five times the speed of the next fastest judge, and r/LocalLLaMA had shipped three open weight imitations. Here is what builders did with a model that refuses to chat, what they complained about, and how to evaluate one for your own pipeline.