Open any request, down to the token.
Cost, tokens, latency, cache and finish reason on every call through the gateway. Nothing to instrument, no SDK to install.
One integration, not two
Most teams run a gateway and bolt an observability SDK beside it. The gateway already sees every request, so the telemetry comes from where the traffic already is.
- No SDK in your appNothing to version, nothing to upgrade
- Any languageThe record is made at the gateway, not in a client
- IncludedSame account, same dashboard, no second bill
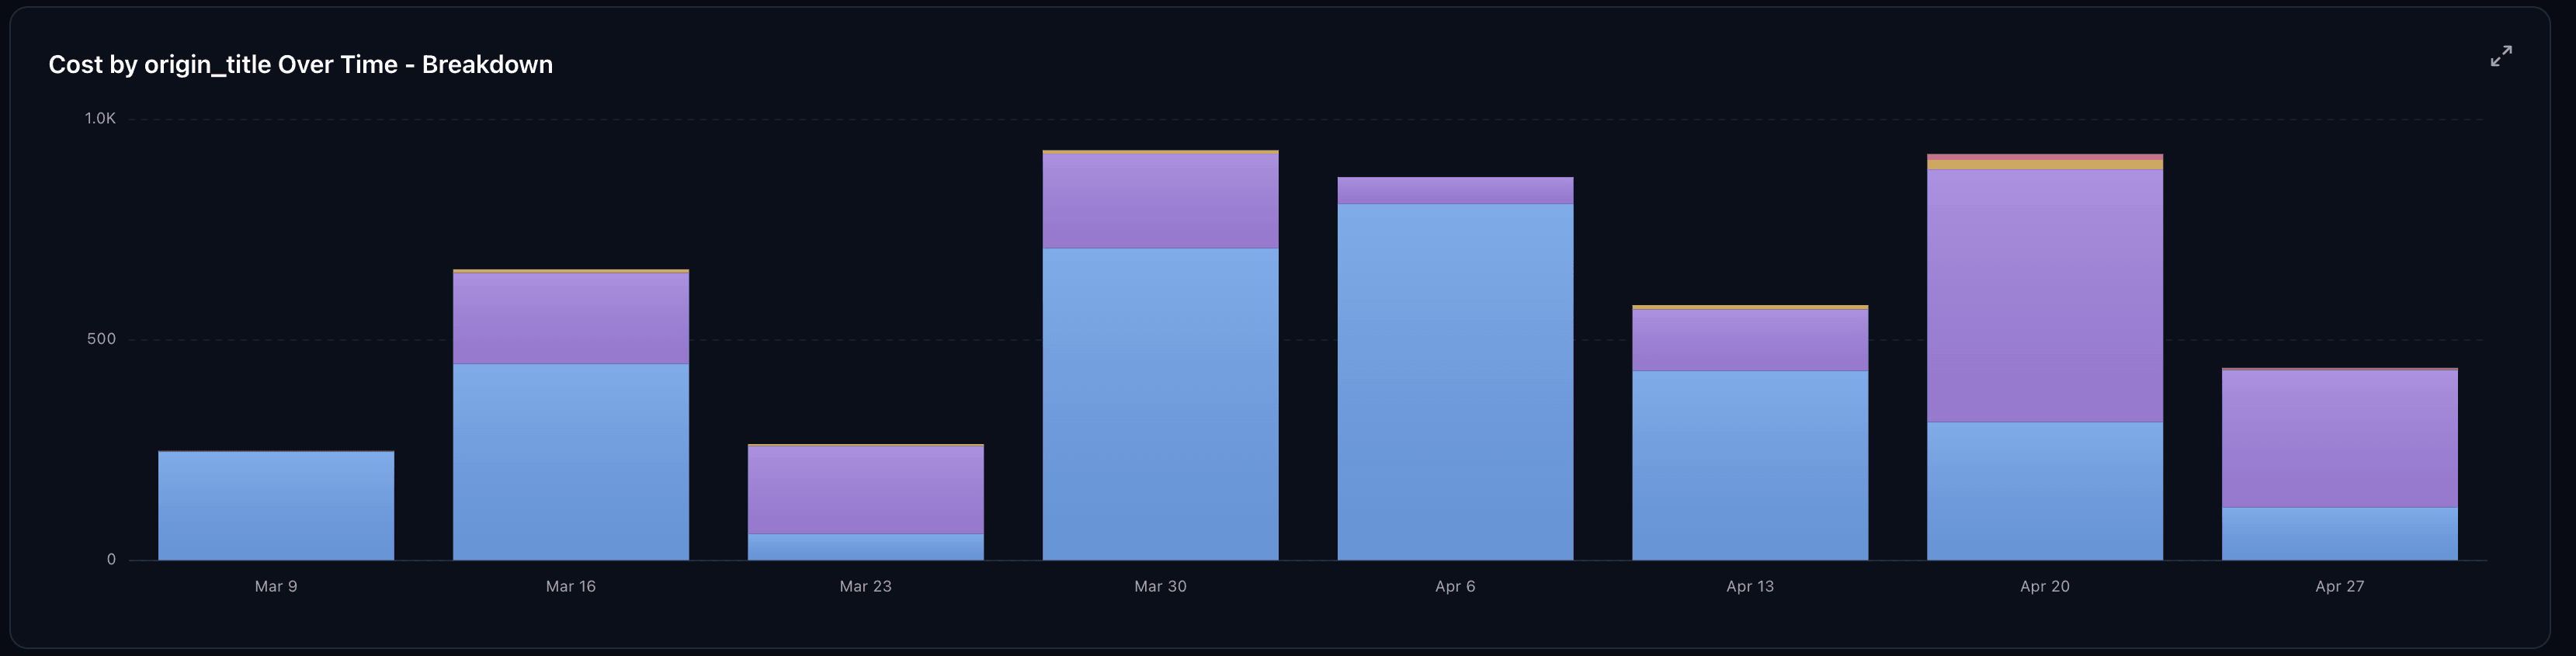
See where the money goes
Spend over time by origin, model, team, user or key, and by any metadata you attach. The same view that shows a cost spike shows which route caused it.
Replay a whole session
Requests are stitched back into the session they came from. You see where a run turned expensive or went wrong, not one row at a time.
- Turn by turnPrompt, response, finish reason
- Every tool callMost of an agent run is tool calls. They are all here.
Latency you can act on
Time to first token is what the person waiting feels. The dashboard splits it from total latency per model and per provider, so a regression points at a route.
Find the call that caused it
Percentiles tell you something moved. These tell you which request moved it.

Numbers are only useful if you can act on them
Spend sits next to the caps that contain it. Latency sits next to the policies that route around it.
See the next request you send
Change the base URL, and the dashboard fills in on its own.