
Requesty
DraftFigures need sign-off before this week is published.

The Gateway Charts · Week 46, 2026

Last week in AI. Who climbed. Who slipped.

Every request through the Requesty gateway names a model, a host and the app that sent it. Each week we rank them against the week before and pull out what changed, and what it means for what you build.

Latest monthly release
October
2026
6 series
Explore →

01 Rankings

deepseek-v4.1-flash pulled further ahead.

deepseek-v4.1-flash held #1 on the Requesty gateway in week 46 (Nov 9 to 15, 2026) with 28.3% of tokens, up 2.27 points on the week before.

Share of tokens, each team capped at 2%Week 46 · Gateway data
This week, against last week
RankModelThis weekChange
  1. Rank 1. deepseek-v4.1-flash=DeepSeek28.3%+2.27 pts
  2. Rank 2. claude-opus-5-5=Anthropic10.5%+0.28 pts
  3. Rank 3. gpt-6-luna=OpenAI8.46%+0.13 pts
  4. Rank 4. glm-5.3-flash=Z.ai5.42%−0.62 pts
  5. Rank 5. claude-sonnet-5-51Up 1 from #6Anthropic5.35%+0.08 pts
  6. Rank 6. gpt-6.1-sol1Down 1 from #5OpenAI5.04%−0.36 pts
  7. Rank 7. deepseek-v4-flash=DeepSeek4.57%+0.31 pts
  8. Rank 8. claude-haiku-5-5=Anthropic3.75%+0.25 pts
  9. Rank 9. nemotron-3-ultra-550b-a55b1Up 1 from #10NVIDIA2.40%+0.03 pts
  10. Rank 10. claude-sonnet-51Up 1 from #11Anthropic2.18%+0.17 pts
DeepSeek
deepseek-v4-flash
This week
#7 · 4.57%
Last week
#7 · 4.26%
Change
+0.31 pts
Peak
#1
Weeks on chart
12 of 12
Data
Data for: deepseek-v4.1-flash pulled further ahead.
RankLast weekNameShareChange
11deepseek-v4.1-flash28.3%+2.27 pts
22claude-opus-5-510.5%+0.28 pts
33gpt-6-luna8.46%+0.13 pts
44glm-5.3-flash5.42%−0.62 pts
56claude-sonnet-5-55.35%+0.08 pts
65gpt-6.1-sol5.04%−0.36 pts
77deepseek-v4-flash4.57%+0.31 pts
88claude-haiku-5-53.75%+0.25 pts
910nemotron-3-ultra-550b-a55b2.40%+0.03 pts
1011claude-sonnet-52.18%+0.17 pts

01b Where the week's tokens went

DeepSeek took a third of all tokens.

DeepSeek models took 34.1% of tokens on the Requesty gateway in week 46 (Nov 9 to 15, 2026); Azure served the most of any host, 15.3%, and the OpenAI Python SDK sent the most of any app, 21.3%.

Apps → labs → hostsWeek 46 · Gateway data · each team capped at 2%
Follow a lab
Is served by
DeepSeek 34.1%
Inference Providers
88%
AI Labs
12%
DataShares of the week's tokens, each team capped at 2%
Apps and SDKs
OpenAI Python SDK21.27%
OpenCode13.14%
Vercel AI SDK10.06%
Claude Code9.82%
Pi6.64%
JS runtime fetch5.49%
Python HTTP3.86%
Anthropic SDK2.50%
OpenAI SDK (other)2.36%
DeepSeek Harness2.15%
Everything else22.70%
Labs
DeepSeek34.07%
Anthropic24.40%
OpenAI19.69%
Z.ai6.62%
Google4.47%
NVIDIA3.59%
MiniMax0.94%
Other labs6.23%
Host type
Inference Providers45.16%
Hyperscalers38.93%
AI Labs15.91%
Hosts
Azure15.28%
Bedrock12.92%
Sference11.62%
DeepInfra8.90%
Melious7.28%
Vertex (Claude)6.60%
Anthropic4.84%
OpenAI4.41%
Vertex (Gemini)4.08%
DeepSeek4.05%
Other hosts20.03%

02 Apps

Coding agents sent a third of tokens.

Five coding agents (OpenCode, Claude Code, Pi, DeepSeek Harness and GitHub Copilot) sent 33.4% of tokens through the Requesty gateway in week 46 (Nov 9 to 15, 2026).

Share of tokens by calling app, team-cappedWeek 46 · Gateway data
  • OpenAI Python SDKSDK or framework21.3%+2.16 pts
  • OpenCodeCoding agent13.1%−1.00 pts
  • Vercel AI SDKSDK or framework10.1%+0.77 pts
  • Claude CodeCoding agent9.83%−1.65 pts
  • PiCoding agent6.64%+3.11 pts
  • Anthropic SDKSDK or framework2.51%−0.16 pts
  • OpenAI SDK (other)SDK or framework2.36%−0.13 pts
  • DeepSeek HarnessCoding agent2.15%−0.54 pts
  • LiteLLMSDK or framework2.11%+0.21 pts
  • GitHub CopilotCoding agent1.60%−0.33 pts
Coding agent
OpenCode
This week
13.1%
Last week
14.1%
Change
−1.00 pts
Place in this chart
#2 of 10
Data
Data for: Coding agents sent a third of tokens.
NameThis weekLast week
OpenAI Python SDK21.3%19.1%
OpenCode13.1%14.1%
Vercel AI SDK10.1%9.3%
Claude Code9.8%11.5%
Pi6.6%3.5%
Anthropic SDK2.5%2.7%
OpenAI SDK (other)2.4%2.5%
DeepSeek Harness2.1%2.7%
LiteLLM2.1%1.9%
GitHub Copilot1.6%1.9%

02b What agents do all day

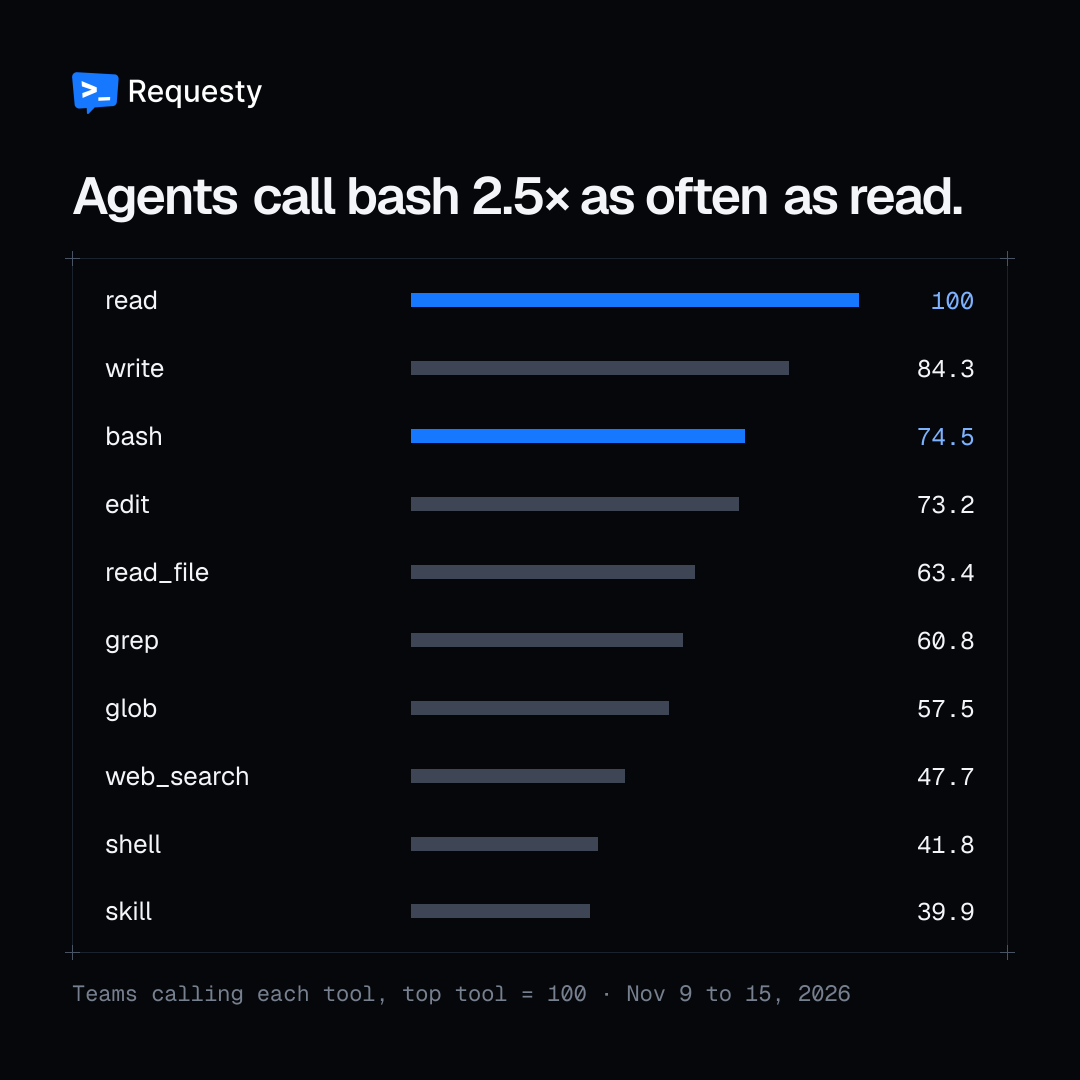
Agents call bash 2.5× as often as read.

read was the tool the most teams' models called on the Requesty gateway in week 46 (Nov 9 to 15, 2026); bash was called 2.5x as often.
Run Claude Code through Requesty →Own page
Share this finding · Week 46
Agents call bash 2.5× as often as read.
Preview on X1080 × 1080
>_
Requesty
@RequestyAI

What agents did all day on Requesty last week (Nov 9 to 15): read, write, bash, edit, read_file. read is the tool the most teams call; bash is called most often, 2.5x as much. requesty.ai/data/weekly/2026-w46/agent-tools

Requesty, The Gateway Charts, week 46 (Nov 9 to 15, 2026). Agents call bash 2.5× as often as read. 2.5× bash calls for every read call. read was the tool the most teams' models called on the Requesty gateway in week 46 (Nov 9 to 15, 2026); bash was called 2.5x as often.
Platform
Image
Text
The link to this finding is added for you199 / 280
Download PNG

On desktop: copy the image, open X, paste. The text is filled in for you. On a phone, Share sends the image and text to the app in one go.

PNG ↓
Tool callsWeek 46 · Gateway data
teams using it, top = 100 times called, top = 100
  1. read
  2. write
  3. bash
  4. edit
  5. read_file
  6. grep
  7. glob
  8. web_search
  9. shell
  10. skill
  11. terminal
  12. execute_code
  13. write_file
  14. search_files
  15. webfetch
  16. skill_view

Dot on a square-root scale. Tools named by 20+ teams; MCP server tools left out.

02c A few long sessions burn most of the tokens

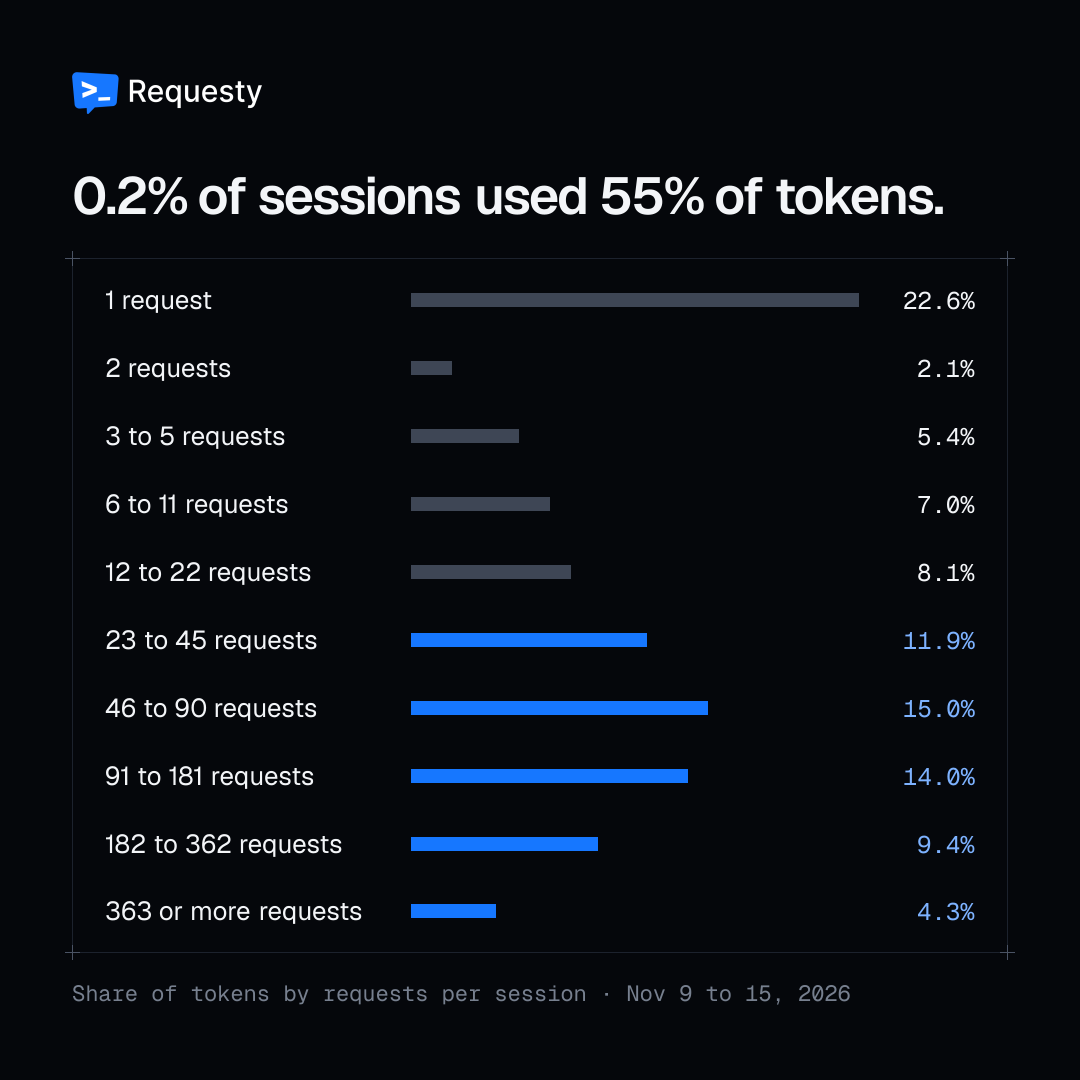
0.2% of sessions used 55% of tokens.

Sessions of 23 requests or more were 0.19% of sessions on the Requesty gateway in week 46 (Nov 9 to 15, 2026), but used 54.7% of tokens.
Turn on auto caching →Own page
Share this finding · Week 46
0.2% of sessions used 55% of tokens.
Preview on X1080 × 1080
>_
Requesty
@RequestyAI

96.4% of sessions on Requesty last week were a single request. Sessions of 23+ requests were 0.19% of sessions but used 54.7% of all tokens (Nov 9 to 15). requesty.ai/data/weekly/2026-w46/session-length

Requesty, The Gateway Charts, week 46 (Nov 9 to 15, 2026). 0.2% of sessions used 55% of tokens. 54.7% of tokens, in sessions of 23+ requests. Sessions of 23 requests or more were 0.19% of sessions on the Requesty gateway in week 46 (Nov 9 to 15, 2026), but used 54.7% of tokens.
Platform
Image
Text
The link to this finding is added for you178 / 280
Download PNG

On desktop: copy the image, open X, paste. The text is filled in for you. On a phone, Share sends the image and text to the app in one go.

PNG ↓
Sessions by lengthWeek 46 · Gateway data
SHARE OF SESSIONSSHARE OF TOKENS
  1. 96.4%1 request22.6%
  2. 1.4%22.1%
  3. 1.3%3 to 55.4%
  4. 0.6%6 to 117.0%
  5. 0.2%12 to 228.1%
  6. 0.1%23 to 4511.9%
  7. 0.05%46 to 9015.0%
  8. 0.02%91 to 18114.0%
  9. <0.01%182 to 3629.4%
  10. <0.01%363 to 7243.7%
  11. <0.01%725 or more0.6%

03 Usage

Most teams used more than one model.

67.6% of active teams on the Requesty gateway used two or more models in week 46 (Nov 9 to 15, 2026); 58.6% used two or more labs and 60.2% two or more providers.

How many models, labs and providers each team usedWeek 46 · Gateway data
67.6%

of active teams used two or more models in week 46

Median team
2 models
Loyal to one
32.4%
Use 6 or more
18.6%
Loyal to one · 32.4%Two or more · 67.6%Each dot is1 in 100 teams1 model: 32.4% of active teams32.4%12 models: 19.0% of active teams19.0%23 models: 13.6% of active teams13.6%34 models: 9.8% of active teams9.8%45 models: 6.7% of active teams6.7%56 models: 4.0% of active teams4.0%67 models: 3.2% of active teams3.2%78 models: 3.2% of active teams3.2%89 models: 1.6% of active teams1.6%910 models: 1.0% of active teams1.0%1011 models: 0.7% of active teams0.7%1112+ models: 4.9% of active teams4.9%12+Models used in the week →
Data
Data for: Most teams used more than one model.
1234 to 56 or moreTwo or more
Models32.4%19.0%13.6%16.5%18.6%67.6%
Labs41.4%25.4%13.7%12.2%7.3%58.6%
Providers39.8%26.3%12.2%12.3%9.4%60.2%

04 Speed

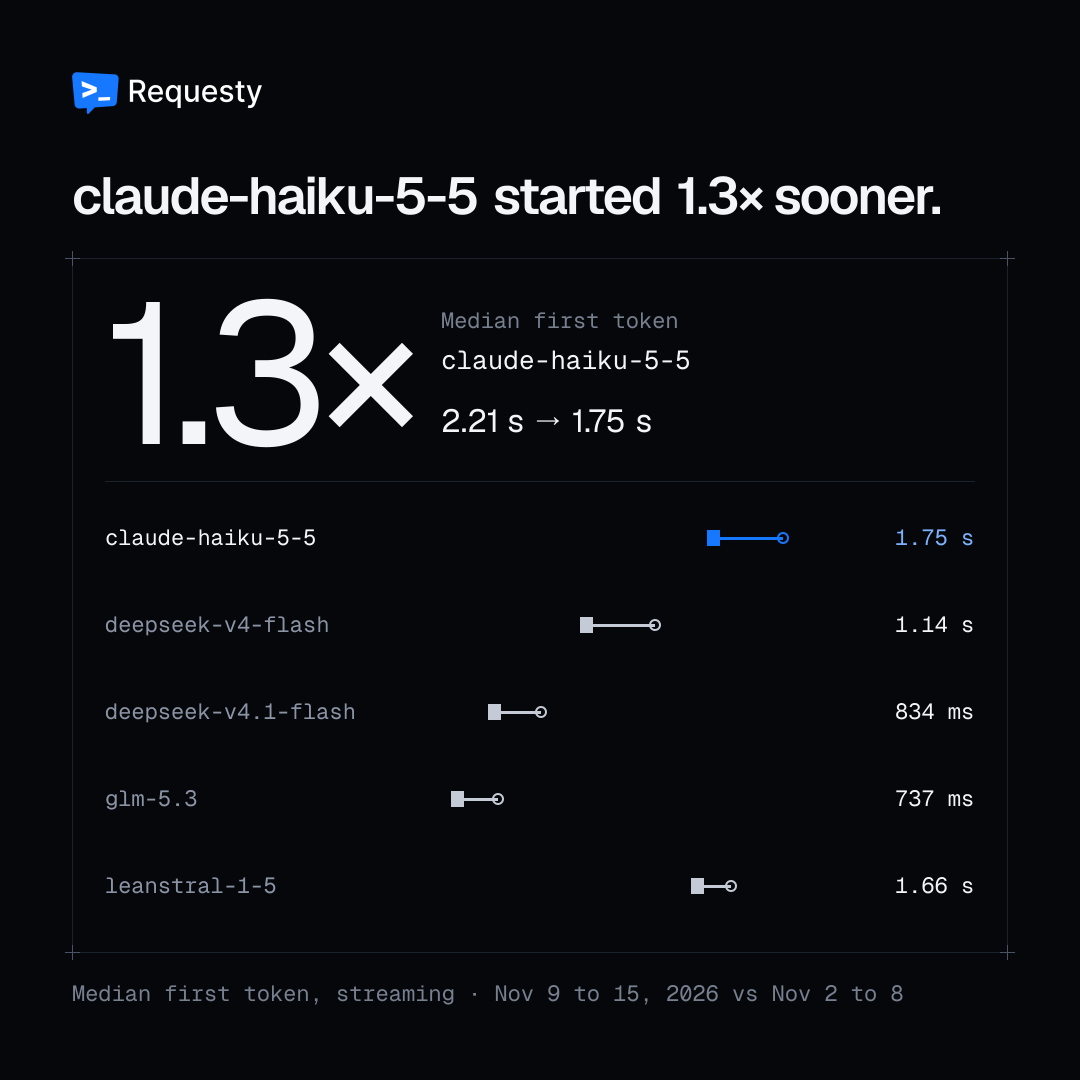
claude-haiku-5-5 started 1.3× sooner.

claude-haiku-5-5 reached its first token 1.3x sooner on the Requesty gateway in week 46 (Nov 9 to 15, 2026): a median of 1.76 s, down from 2.21 s the week before, on streaming requests.
Let the gateway pick the fastest host →Own page
Share this finding · Week 46
claude-haiku-5-5 started 1.3× sooner.
Preview on X1080 × 1080
>_
Requesty
@RequestyAI

Speed-up of the week on Requesty: claude-haiku-5-5. Median time to first token went from 2.21 s to 1.76 s (Nov 9 to 15 vs the week before), 1.3x sooner. Measured at the gateway on streaming requests. requesty.ai/data/weekly/2026-w46/speed-up

Requesty, The Gateway Charts, week 46 (Nov 9 to 15, 2026). claude-haiku-5-5 started 1.3× sooner. 1.3× median time to first token, this week vs last. claude-haiku-5-5 reached its first token 1.3x sooner on the Requesty gateway in week 46 (Nov 9 to 15, 2026): a median of 1.76 s, down from 2.21 s the week before, on streaming requests.
Platform
Image
Text
The link to this finding is added for you223 / 280
Download PNG

On desktop: copy the image, open X, paste. The text is filled in for you. On a phone, Share sends the image and text to the app in one go.

PNG ↓
Median first token, streamingWeek 46 · Gateway data
Last weekThis week
ModelChange
  • claude-haiku-5-51.3× sooner
  • deepseek-v4-flash1.3× sooner
  • deepseek-v4.1-flash1.2× sooner
  • glm-5.31.1× sooner
  • leanstral-1-51.1× sooner
1 s
Median first token, streaming
claude-haiku-5-5
Last week
2.21 s
This week
1.75 s
Change
1.26× sooner
Relative
−20% Faster
Data
Data for: claude-haiku-5-5 started 1.3× sooner.
ModelLast weekThis weekChange
claude-haiku-5-52.21 s1.75 s1.3× sooner
deepseek-v4-flash1.43 s1.14 s1.3× sooner
deepseek-v4.1-flash972 ms834 ms1.2× sooner
glm-5.3842 ms737 ms1.1× sooner
leanstral-1-51.85 s1.66 s1.1× sooner

04c Same weights, different metal

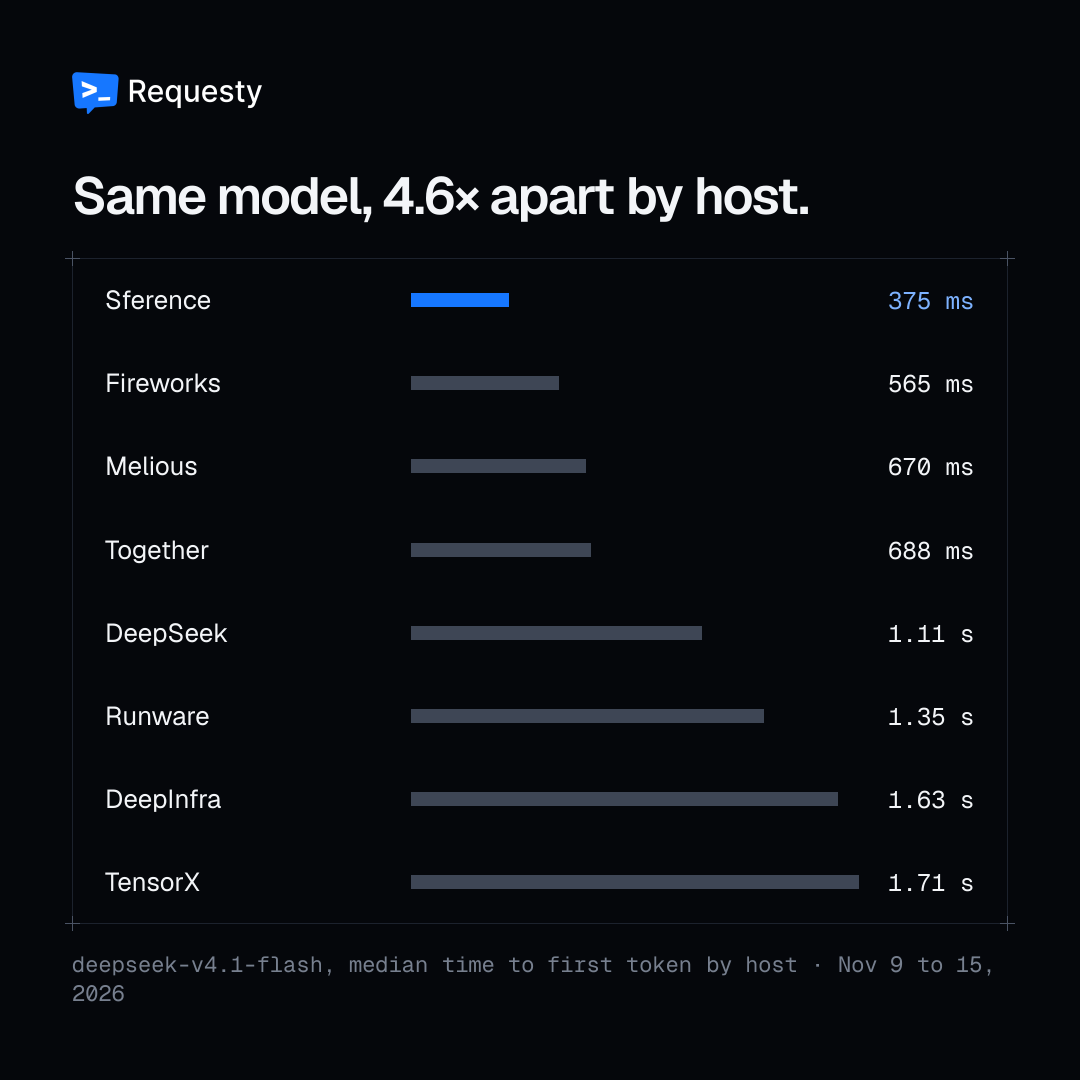
Same model, 4.6× apart by host.

The same model, deepseek-v4.1-flash, reached its first token 4.6x sooner on Sference (375 ms median) than on TensorX (1.71 s) on the Requesty gateway in week 46 (Nov 9 to 15, 2026).
Let the gateway pick the fastest host →Own page
Share this finding · Week 46
Same model, 4.6× apart by host.
Preview on X1080 × 1080
>_
Requesty
@RequestyAI

Same weights, different metal. deepseek-v4.1-flash on Requesty last week: 375 ms to the first token on Sference, 1.71 s on TensorX. 4.6x apart for the same model (Nov 9 to 15). requesty.ai/data/weekly/2026-w46/same-model-hosts

Requesty, The Gateway Charts, week 46 (Nov 9 to 15, 2026). Same model, 4.6× apart by host. 4.6× slowest vs fastest host, median time to first token, deepseek-v4.1-flash. The same model, deepseek-v4.1-flash, reached its first token 4.6x sooner on Sference (375 ms median) than on TensorX (1.71 s) on the Requesty gateway in week 46 (Nov 9 to 15, 2026).
Platform
Image
Text
The link to this finding is added for you200 / 280
Download PNG

On desktop: copy the image, open X, paste. The text is filled in for you. On a phone, Share sends the image and text to the app in one go.

PNG ↓
One model, every hostWeek 46 · Gateway data
Pick a model · bar: middle half of requests · dot: median · tick: p90
100 ms300 ms1 s3 s10 s30 sTIME TO FIRST TOKENTOK/SSHARESference375 ms26020%Fireworks565 ms1883%Melious670 ms15131%Together688 ms3053%DeepSeek1.11 s2069%Runware1.35 s2547%DeepInfra1.63 s14423%TensorX1.71 s3735%
deepseek-v4.1-flash
Sference
TTFT p25
238 ms
Median
375 ms
p75
674 ms
p90
1.30 s
p99
6.5 s
Speed median
260 tok/s
Provider errors
0.40%
Share of this model
19.5%

04b Latency is a distribution

glm-5.3-flash was quickest to start.

glm-5.3-flash had the quickest median first token of the 12 busiest models on the Requesty gateway in week 46 (Nov 9 to 15, 2026), 746 ms; for deepseek-v4-flash the slowest 1% of requests waited 36x its median.

Time to first token and stream speedStreaming requests · Week 46 · Gateway data
median slowest 10% start here
100 ms300 ms1 s3 s10 s30 sglm-5.3-flash746 msdeepseek-v4.1-flash834 msdeepseek-v4-flash1.14 sgpt-6-luna1.68 sclaude-haiku-5-51.75 snemotron-3-ultra-550b-a55b1.87 sclaude-sonnet-52.32 sgpt-5.6-luna2.46 sgpt-6.1-terra2.71 sclaude-sonnet-5-52.73 sgpt-6.1-sol3.5 sclaude-opus-5-53.8 s
Z.ai
glm-5.3-flash
Fastest 10%
under 246 ms
Median
746 ms
p75
1.51 s
p90
3.3 s
p99
14 s
p99 vs median
19×

05 Reliability

96% of failed requests still got served.

In week 46 (Nov 9 to 15, 2026), 96.1% of requests on a fallback policy whose first attempt hit a provider error were still served by another host on the Requesty gateway, up from 86.4% the week before.

Requests whose first host failedWeek 46 · Gateway data
Routing policy
Still served 96.1%Still failed 3.9%
Fallback policy
96.1%
First host failed, still served
Latency policy
79.0%
First host failed, still served
Same model served
79.1%
Of rescues, same model on another host
Fallback policy
192 of 200 served
Served by another host
96.1%
Still failed
3.9%
One dot
0.5% of these requests
Data
Data for: 96% of failed requests still got served.
MeasureValue
Still served96.1%
Still failed3.9%
Fallback policy96.1%
Latency policy79.0%
Same model served79.1%

05b Host form

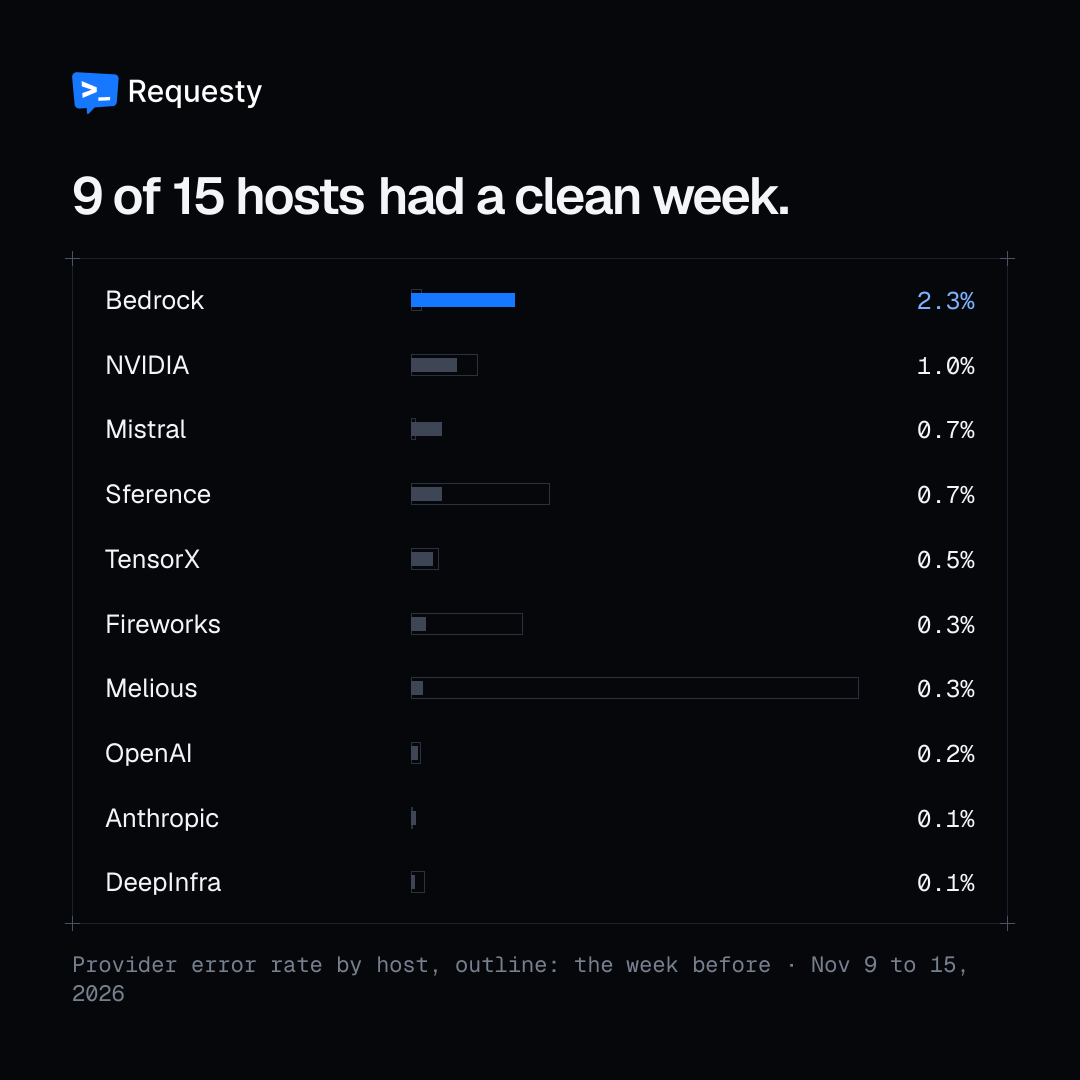
9 of 15 hosts had a clean week.

9 of the 15 busiest hosts on the Requesty gateway kept provider errors under 0.3% in week 46 (Nov 9 to 15, 2026); Bedrock had the most, 2.30%.
Set up a fallback policy →Own page
Share this finding · Week 46
9 of 15 hosts had a clean week.
Preview on X1080 × 1080
>_
Requesty
@RequestyAI

Host form on Requesty last week (Nov 9 to 15): 9 of the 15 busiest hosts kept provider errors under 0.3%. Most errors: Bedrock, 2.30%, from 0.24% the week before. requesty.ai/data/weekly/2026-w46/host-form

Requesty, The Gateway Charts, week 46 (Nov 9 to 15, 2026). 9 of 15 hosts had a clean week. 9 of the 15 busiest hosts kept provider errors under 0.3%. 9 of the 15 busiest hosts on the Requesty gateway kept provider errors under 0.3% in week 46 (Nov 9 to 15, 2026); Bedrock had the most, 2.30%.
Platform
Image
Text
The link to this finding is added for you186 / 280
Download PNG

On desktop: copy the image, open X, paste. The text is filled in for you. On a phone, Share sends the image and text to the app in one go.

PNG ↓
Form guideTop 15 hosts by share of tokens · Week 46 · Gateway data
Provider error rate per week · then this week against last clean week, under 0.3%1%5%15%+
Sep 7Sep 28Oct 19Nov 9ERRORSVS LAST WKAzure: 0.05% provider errors this week, 16.3% of tokens01AzureAzure, week of Aug 24: 3.42% provider errors3.4Azure, week of Aug 31: 0.65% provider errorsAzure, week of Sep 7: 4.01% provider errors4.0Azure, week of Sep 14: 0.55% provider errorsAzure, week of Sep 21: 0.61% provider errorsAzure, week of Sep 28: 32.01% provider errors32Azure, week of Oct 5: 0.55% provider errorsAzure, week of Oct 12: 0.83% provider errorsAzure, week of Oct 19: 0.76% provider errorsAzure, week of Oct 26: 3.21% provider errors3.2Azure, week of Nov 2: 3.17% provider errors3.2Azure, week of Nov 9: 0.05% provider errors0.05%−3.12Bedrock: 2.30% provider errors this week, 12.8% of tokens02BedrockBedrock, week of Aug 24: 0.31% provider errorsBedrock, week of Aug 31: 0.12% provider errorsBedrock, week of Sep 7: 0.43% provider errorsBedrock, week of Sep 14: 0.56% provider errorsBedrock, week of Sep 21: 0.05% provider errorsBedrock, week of Sep 28: 3.52% provider errors3.5Bedrock, week of Oct 5: 9.00% provider errors9.0Bedrock, week of Oct 12: 0.64% provider errorsBedrock, week of Oct 19: 0.03% provider errorsBedrock, week of Oct 26: 0.20% provider errorsBedrock, week of Nov 2: 0.24% provider errorsBedrock, week of Nov 9: 2.30% provider errors2.32.30%+2.06Sference: 0.68% provider errors this week, 10.4% of tokens03SferenceSference, week of Aug 24: 0.35% provider errorsSference, week of Aug 31: 0.41% provider errorsSference, week of Sep 7: 6.09% provider errors6.1Sference, week of Sep 14: 0.76% provider errorsSference, week of Sep 21: 0.16% provider errorsSference, week of Sep 28: 3.70% provider errors3.7Sference, week of Oct 5: 3.67% provider errors3.7Sference, week of Oct 12: 1.67% provider errorsSference, week of Oct 19: 0.21% provider errorsSference, week of Oct 26: 6.21% provider errors6.2Sference, week of Nov 2: 3.09% provider errors3.1Sference, week of Nov 9: 0.68% provider errors0.68%−2.41Melious: 0.26% provider errors this week, 9.69% of tokens04MeliousMelious, week of Oct 5: 0.01% provider errorsMelious, week of Oct 12: 0.07% provider errorsMelious, week of Oct 19: 0.15% provider errorsMelious, week of Oct 26: 0.88% provider errorsMelious, week of Nov 2: 9.94% provider errors9.9Melious, week of Nov 9: 0.26% provider errors0.26%−9.68DeepInfra: 0.08% provider errors this week, 7.59% of tokens05DeepInfraDeepInfra, week of Aug 24: 0.58% provider errorsDeepInfra, week of Aug 31: 0.67% provider errorsDeepInfra, week of Sep 7: 44.53% provider errors45DeepInfra, week of Sep 14: 35.02% provider errors35DeepInfra, week of Sep 21: 5.85% provider errors5.8DeepInfra, week of Sep 28: 1.09% provider errorsDeepInfra, week of Oct 5: 1.94% provider errorsDeepInfra, week of Oct 12: 2.15% provider errors2.1DeepInfra, week of Oct 19: 7.50% provider errors7.5DeepInfra, week of Oct 26: 16.61% provider errors17DeepInfra, week of Nov 2: 0.32% provider errorsDeepInfra, week of Nov 9: 0.08% provider errors0.08%−0.24Vertex (Claude): 0.02% provider errors this week, 7.09% of tokens06Vertex (Claude)Vertex (Claude), week of Aug 24: 14.28% provider errors14Vertex (Claude), week of Aug 31: 0.01% provider errorsVertex (Claude), week of Sep 7: 0.00% provider errorsVertex (Claude), week of Sep 14: 0.12% provider errorsVertex (Claude), week of Sep 21: 0.15% provider errorsVertex (Claude), week of Sep 28: 0.08% provider errorsVertex (Claude), week of Oct 5: 0.92% provider errorsVertex (Claude), week of Oct 12: 0.05% provider errorsVertex (Claude), week of Oct 19: 0.05% provider errorsVertex (Claude), week of Oct 26: 0.03% provider errorsVertex (Claude), week of Nov 2: 0.05% provider errorsVertex (Claude), week of Nov 9: 0.02% provider errors0.02%−0.03Anthropic: 0.11% provider errors this week, 4.33% of tokens07AnthropicAnthropic, week of Aug 24: 0.05% provider errorsAnthropic, week of Aug 31: 0.24% provider errorsAnthropic, week of Sep 7: 0.09% provider errorsAnthropic, week of Sep 14: 26.09% provider errors26Anthropic, week of Sep 21: 0.22% provider errorsAnthropic, week of Sep 28: 0.18% provider errorsAnthropic, week of Oct 5: 7.91% provider errors7.9Anthropic, week of Oct 12: 0.07% provider errorsAnthropic, week of Oct 19: 0.00% provider errorsAnthropic, week of Oct 26: 2.17% provider errors2.2Anthropic, week of Nov 2: 0.00% provider errorsAnthropic, week of Nov 9: 0.11% provider errors0.11%+0.11Vertex (Gemini): 0.07% provider errors this week, 4.16% of tokens08Vertex (Gemini)Vertex (Gemini), week of Aug 24: 1.23% provider errorsVertex (Gemini), week of Aug 31: 0.55% provider errorsVertex (Gemini), week of Sep 7: 0.30% provider errorsVertex (Gemini), week of Sep 14: 0.28% provider errorsVertex (Gemini), week of Sep 21: 0.22% provider errorsVertex (Gemini), week of Sep 28: 0.23% provider errorsVertex (Gemini), week of Oct 5: 0.89% provider errorsVertex (Gemini), week of Oct 12: 0.37% provider errorsVertex (Gemini), week of Oct 19: 0.34% provider errorsVertex (Gemini), week of Oct 26: 0.36% provider errorsVertex (Gemini), week of Nov 2: 0.06% provider errorsVertex (Gemini), week of Nov 9: 0.07% provider errors0.07%+0.01OpenAI: 0.16% provider errors this week, 3.74% of tokens09OpenAIOpenAI, week of Aug 24: 0.36% provider errorsOpenAI, week of Aug 31: 0.23% provider errorsOpenAI, week of Sep 7: 0.05% provider errorsOpenAI, week of Sep 14: 0.04% provider errorsOpenAI, week of Sep 21: 0.26% provider errorsOpenAI, week of Sep 28: 0.13% provider errorsOpenAI, week of Oct 5: 0.30% provider errorsOpenAI, week of Oct 12: 0.22% provider errorsOpenAI, week of Oct 19: 0.06% provider errorsOpenAI, week of Oct 26: 0.35% provider errorsOpenAI, week of Nov 2: 0.23% provider errorsOpenAI, week of Nov 9: 0.16% provider errors0.16%−0.07TensorX: 0.49% provider errors this week, 3.58% of tokens10TensorXTensorX, week of Aug 24: 9.33% provider errors9.3TensorX, week of Aug 31: 0.45% provider errorsTensorX, week of Sep 7: 0.41% provider errorsTensorX, week of Sep 14: 1.61% provider errorsTensorX, week of Sep 21: 0.59% provider errorsTensorX, week of Sep 28: 4.11% provider errors4.1TensorX, week of Oct 5: 1.58% provider errorsTensorX, week of Oct 12: 15.92% provider errors16TensorX, week of Oct 19: 1.44% provider errorsTensorX, week of Oct 26: 2.55% provider errors2.5TensorX, week of Nov 2: 0.62% provider errorsTensorX, week of Nov 9: 0.49% provider errors0.49%−0.13DeepSeek: 0.03% provider errors this week, 3.43% of tokens11DeepSeekDeepSeek, week of Aug 24: 0.04% provider errorsDeepSeek, week of Aug 31: 0.09% provider errorsDeepSeek, week of Sep 7: 0.01% provider errorsDeepSeek, week of Sep 14: 0.05% provider errorsDeepSeek, week of Sep 21: 0.08% provider errorsDeepSeek, week of Sep 28: 0.00% provider errorsDeepSeek, week of Oct 5: 0.01% provider errorsDeepSeek, week of Oct 12: 0.29% provider errorsDeepSeek, week of Oct 19: 0.01% provider errorsDeepSeek, week of Oct 26: 0.03% provider errorsDeepSeek, week of Nov 2: 0.79% provider errorsDeepSeek, week of Nov 9: 0.03% provider errors0.03%−0.76NVIDIA: 1.03% provider errors this week, 3.06% of tokens12NVIDIANVIDIA, week of Aug 24: 3.65% provider errors3.6NVIDIA, week of Aug 31: 5.01% provider errors5.0NVIDIA, week of Sep 7: 5.00% provider errors5.0NVIDIA, week of Sep 14: 6.01% provider errors6.0NVIDIA, week of Sep 21: 6.55% provider errors6.5NVIDIA, week of Sep 28: 4.46% provider errors4.5NVIDIA, week of Oct 5: 5.32% provider errors5.3NVIDIA, week of Oct 12: 7.44% provider errors7.4NVIDIA, week of Oct 19: 1.51% provider errorsNVIDIA, week of Oct 26: 1.55% provider errorsNVIDIA, week of Nov 2: 1.48% provider errorsNVIDIA, week of Nov 9: 1.03% provider errors1.03%−0.45Fireworks: 0.33% provider errors this week, 1.12% of tokens13FireworksFireworks, week of Aug 24: 0.34% provider errorsFireworks, week of Aug 31: 0.13% provider errorsFireworks, week of Sep 7: 0.65% provider errorsFireworks, week of Sep 14: 0.42% provider errorsFireworks, week of Sep 21: 4.12% provider errors4.1Fireworks, week of Sep 28: 2.32% provider errors2.3Fireworks, week of Oct 5: 0.32% provider errorsFireworks, week of Oct 12: 0.18% provider errorsFireworks, week of Oct 19: 0.16% provider errorsFireworks, week of Oct 26: 0.03% provider errorsFireworks, week of Nov 2: 2.48% provider errors2.5Fireworks, week of Nov 9: 0.33% provider errors0.33%−2.15Mistral: 0.69% provider errors this week, 0.83% of tokens14MistralMistral, week of Aug 24: 0.28% provider errorsMistral, week of Aug 31: 0.17% provider errorsMistral, week of Sep 7: 0.79% provider errorsMistral, week of Sep 14: 0.15% provider errorsMistral, week of Sep 21: 0.17% provider errorsMistral, week of Sep 28: 0.38% provider errorsMistral, week of Oct 5: 1.06% provider errorsMistral, week of Oct 12: 0.75% provider errorsMistral, week of Oct 19: 0.43% provider errorsMistral, week of Oct 26: 0.27% provider errorsMistral, week of Nov 2: 0.11% provider errorsMistral, week of Nov 9: 0.69% provider errors0.69%+0.58Novita: 0.04% provider errors this week, 0.57% of tokens15NovitaNovita, week of Aug 24: 1.87% provider errorsNovita, week of Aug 31: 2.82% provider errors2.8Novita, week of Sep 7: 0.98% provider errorsNovita, week of Sep 14: 2.73% provider errors2.7Novita, week of Sep 21: 0.36% provider errorsNovita, week of Sep 28: 1.22% provider errorsNovita, week of Oct 5: 1.78% provider errorsNovita, week of Oct 12: 0.55% provider errorsNovita, week of Oct 19: 3.79% provider errors3.8Novita, week of Oct 26: 0.01% provider errorsNovita, week of Nov 2: 2.50% provider errors2.5Novita, week of Nov 9: 0.04% provider errors0.04%−2.46

05c The week, hour by hour

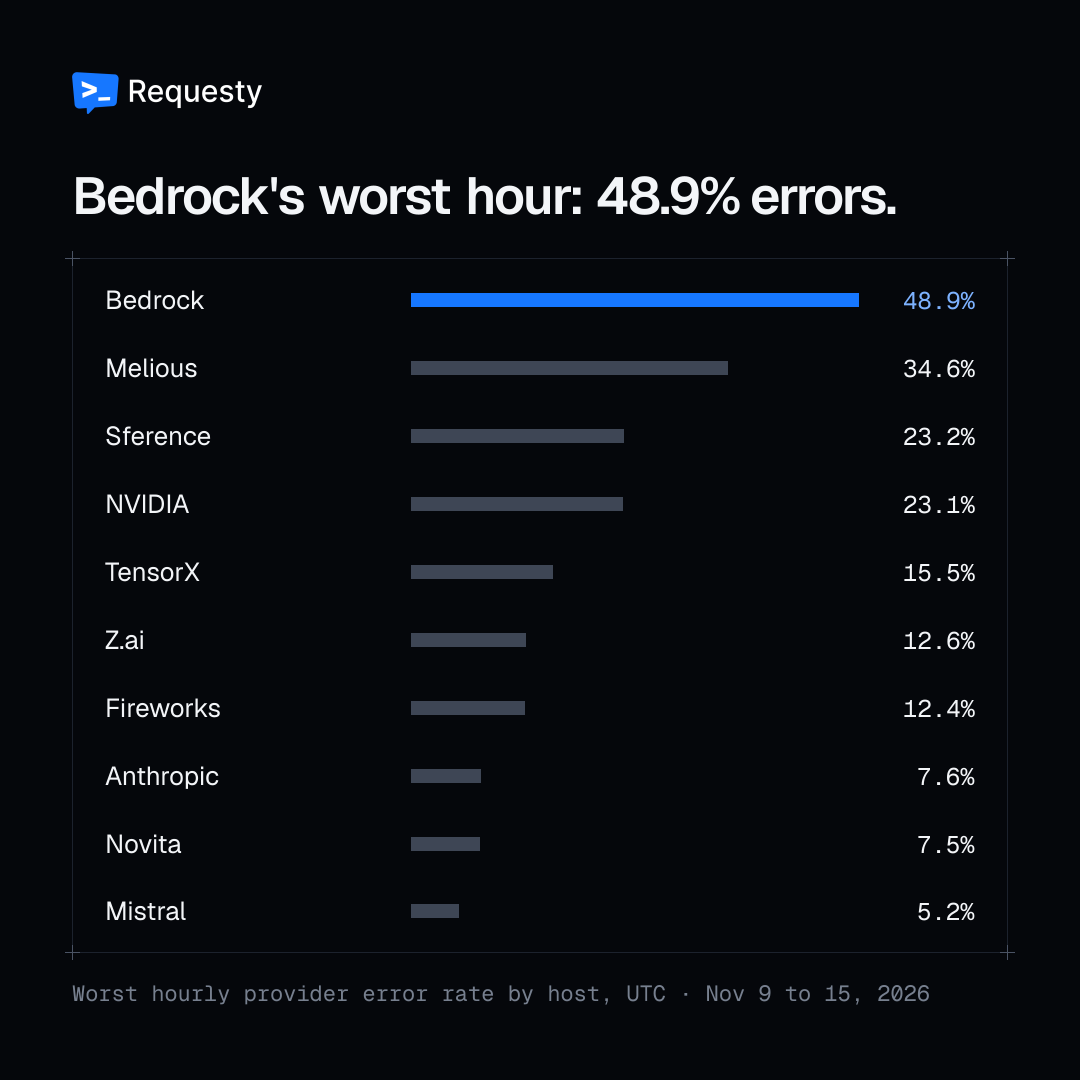
Bedrock's worst hour: 48.9% errors.

The worst hour for any busy host on the Requesty gateway in week 46 (Nov 9 to 15, 2026) was Saturday Nov 14 at 16:00 UTC, when 48.9% of requests to Bedrock came back with a provider error.
Set up a fallback policy →Own page
Share this finding · Week 46
Bedrock's worst hour: 48.9% errors.
Preview on X1080 × 1080
>_
Requesty
@RequestyAI

Worst hour on Requesty last week: Saturday Nov 14, 16:00 UTC. 48.9% of requests to Bedrock hit a provider error. Its average for the week: 2.30%. requesty.ai/data/weekly/2026-w46/host-weather

Requesty, The Gateway Charts, week 46 (Nov 9 to 15, 2026). Bedrock's worst hour: 48.9% errors. 48.9% of requests to Bedrock in the worst hour. The worst hour for any busy host on the Requesty gateway in week 46 (Nov 9 to 15, 2026) was Saturday Nov 14 at 16:00 UTC, when 48.9% of requests to Bedrock came back with a provider error.
Platform
Image
Text
The link to this finding is added for you169 / 280
Download PNG

On desktop: copy the image, open X, paste. The text is filled in for you. On a phone, Share sends the image and text to the app in one go.

PNG ↓
Host weatherWeek 46 · Gateway data
Provider error rate · per hour, UTC0%90%+
MonTueWedThuFriSatSunWEEKAzure0.05%Bedrock2.30%Sference0.68%Melious0.26%DeepInfra0.08%Vertex (Claude)0.02%Anthropic0.11%Vertex (Gemini)0.07%OpenAI0.16%TensorX0.49%DeepSeek0.03%NVIDIA1.03%Fireworks0.33%Mistral0.69%Novita0.04%Z.ai0.11%
Sat 14 · 16:00 UTC · worst hour of the week
Bedrock
Provider error rate
48.9%
Week average
2.30%
Week before
0.24%

06 Caching

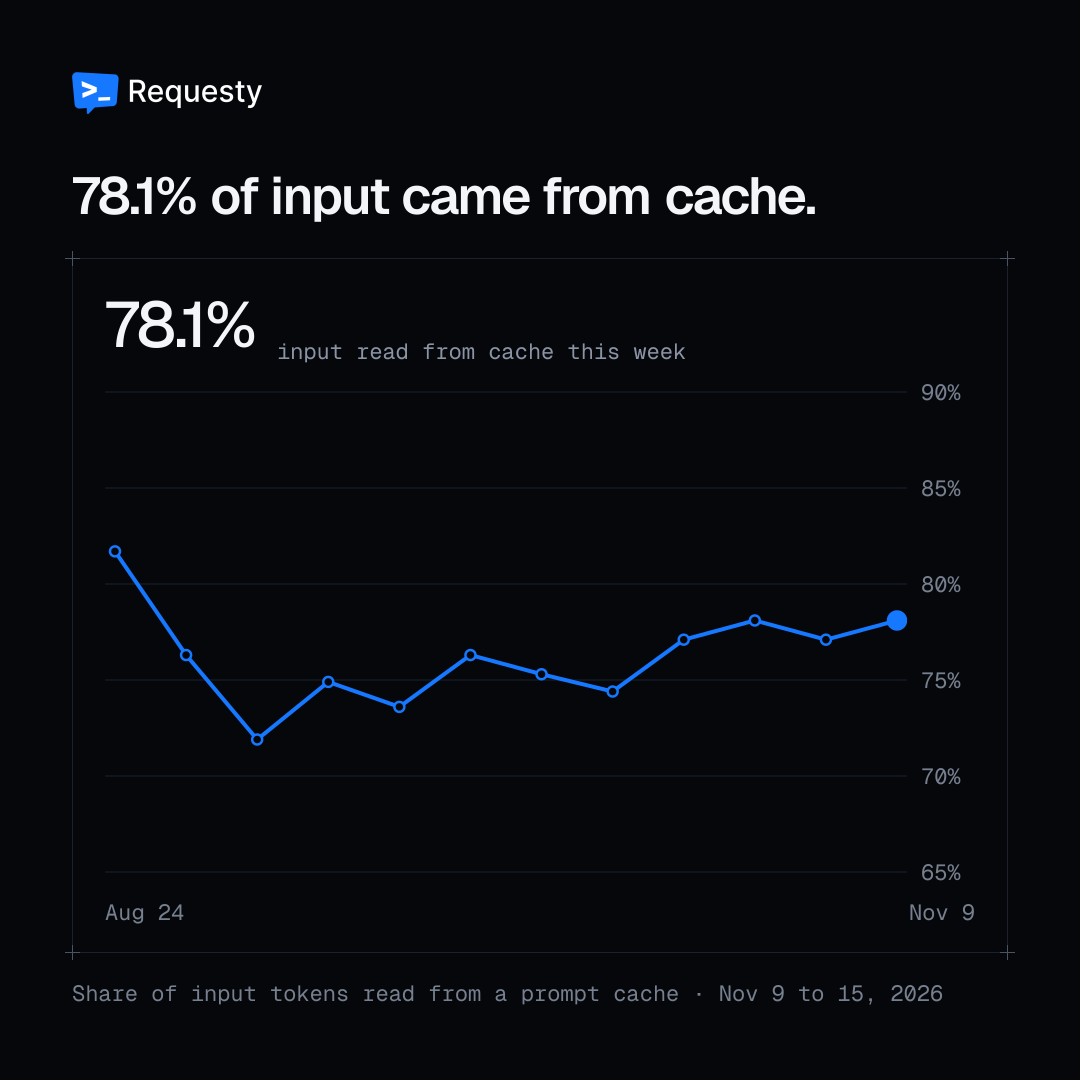
78.1% of input came from cache.

78.1% of input tokens through the Requesty gateway in week 46 (Nov 9 to 15, 2026) were read from a prompt cache; models read 46 input tokens for every output token.
Turn on auto caching →Own page
Share this finding · Week 46
78.1% of input came from cache.
Preview on X1080 × 1080
>_
Requesty
@RequestyAI

78.1% of input tokens on Requesty last week were read from a prompt cache (Nov 9 to 15). Models read 46 input tokens for every token they wrote. Output price is the smaller part of most bills. requesty.ai/data/weekly/2026-w46/prompt-cache

Requesty, The Gateway Charts, week 46 (Nov 9 to 15, 2026). 78.1% of input came from cache. 78.1% of input tokens. 78.1% of input tokens through the Requesty gateway in week 46 (Nov 9 to 15, 2026) were read from a prompt cache; models read 46 input tokens for every output token.
Platform
Image
Text
The link to this finding is added for you216 / 280
Download PNG

On desktop: copy the image, open X, paste. The text is filled in for you. On a phone, Share sends the image and text to the app in one go.

PNG ↓
Share of input tokens read from a prompt cacheWeek 46 · Gateway data
78.1%This week · 12-week range 71.9% to 81.7%
This week
Week of Nov 9
Input read from cache
78.1%
Against the week before
+1.0 pts
12-week average
76.2%
Data
Data for: 78.1% of input came from cache.
Week ofInput read from cache
2026-08-2481.7%
2026-08-3176.3%
2026-09-0771.9%
2026-09-1474.9%
2026-09-2173.6%
2026-09-2876.3%
2026-10-0575.3%
2026-10-1274.4%
2026-10-1977.1%
2026-10-2678.1%
2026-11-0277.1%
2026-11-0978.1%

06b What a warm cache buys

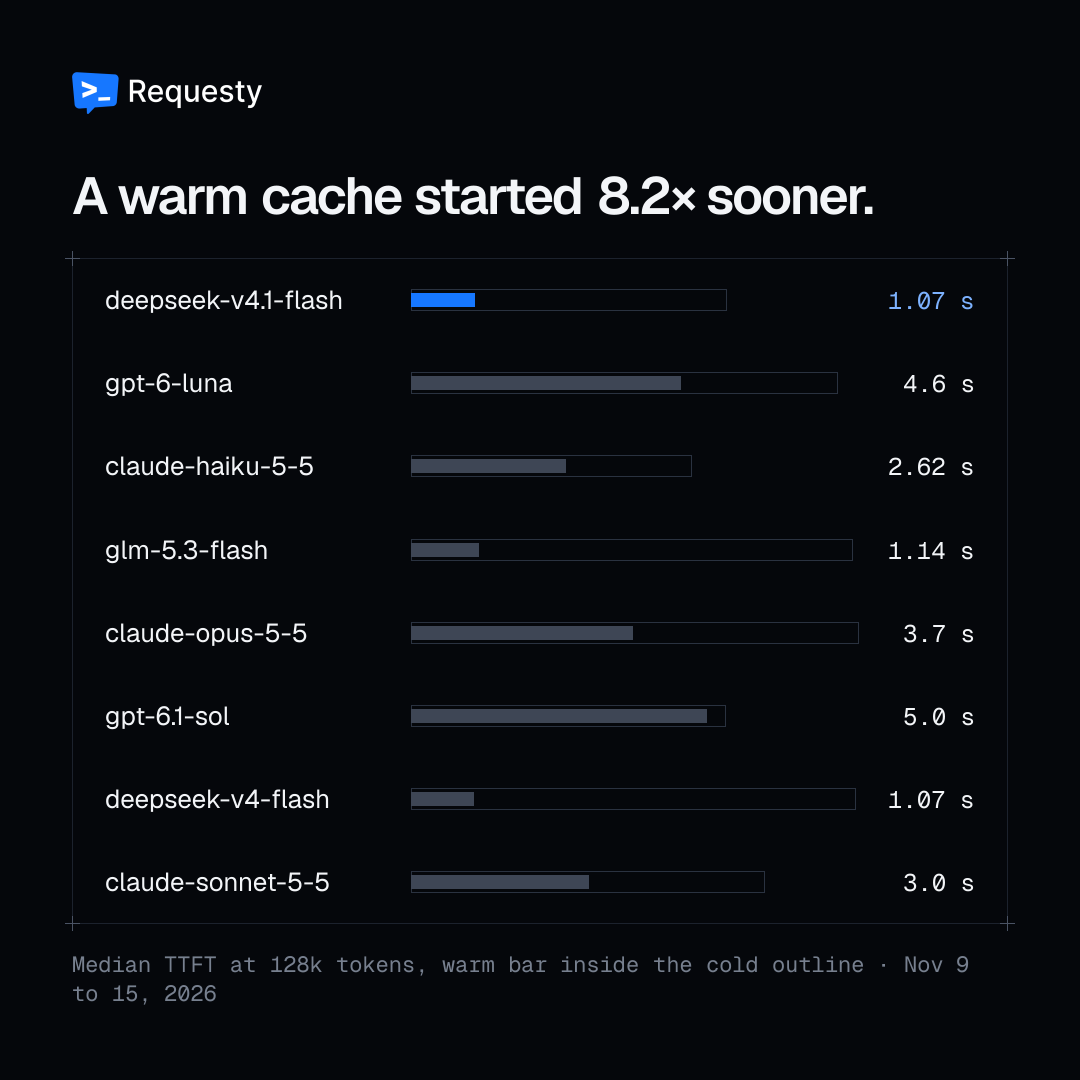
A warm cache started 8.2× sooner.

On the Requesty gateway in week 46 (Nov 9 to 15, 2026), deepseek-v4.1-flash prompts over 512k tokens reached the first token 8.2x sooner when more than half of the input came from cache: 2.65 s against 22 s at the median.
Turn on auto caching →Own page
Share this finding · Week 46
A warm cache started 8.2× sooner.
Preview on X1080 × 1080
>_
Requesty
@RequestyAI

What a warm cache buys: deepseek-v4.1-flash on Requesty last week, prompts over 512k tokens, 22 s to the first token cold and 2.65 s warm. 8.2x sooner (Nov 9 to 15). requesty.ai/data/weekly/2026-w46/warm-cache

Requesty, The Gateway Charts, week 46 (Nov 9 to 15, 2026). A warm cache started 8.2× sooner. 8.2× cold vs warm median time to first token, deepseek-v4.1-flash, prompts over 512k tokens. On the Requesty gateway in week 46 (Nov 9 to 15, 2026), deepseek-v4.1-flash prompts over 512k tokens reached the first token 8.2x sooner when more than half of the input came from cache: 2.65 s against 22 s at the median.
Platform
Image
Text
The link to this finding is added for you189 / 280
Download PNG

On desktop: copy the image, open X, paste. The text is filled in for you. On a phone, Share sends the image and text to the app in one go.

PNG ↓
Cold vs warm cacheMedian TTFT by prompt size · Week 46 · Gateway data
Cold: half or less cachedWarm: over half cachedBand: middle half of requests
100 ms300 ms1 s3 s10 s30 s5124k32k256kinput tokens in the prompt →Cold: half or less cached, 256 tokens: median 498 msCold: half or less cached, 512 tokens: median 334 msCold: half or less cached, 1k tokens: median 323 msCold: half or less cached, 2k tokens: median 437 msCold: half or less cached, 4k tokens: median 472 msCold: half or less cached, 8k tokens: median 742 msCold: half or less cached, 16k tokens: median 927 msCold: half or less cached, 32k tokens: median 1.36 sCold: half or less cached, 64k tokens: median 2.68 sCold: half or less cached, 128k tokens: median 5.3 sCold: half or less cached, 256k tokens: median 11 sCold: half or less cached, 512k tokens: median 22 sWarm: over half cached, 256 tokens: median 373 msWarm: over half cached, 512 tokens: median 194 msWarm: over half cached, 1k tokens: median 397 msWarm: over half cached, 2k tokens: median 436 msWarm: over half cached, 4k tokens: median 218 msWarm: over half cached, 8k tokens: median 425 msWarm: over half cached, 16k tokens: median 647 msWarm: over half cached, 32k tokens: median 723 msWarm: over half cached, 64k tokens: median 847 msWarm: over half cached, 128k tokens: median 1.07 sWarm: over half cached, 256k tokens: median 1.76 sWarm: over half cached, 512k tokens: median 2.65 s
deepseek-v4.1-flash · prompts of 512k to 1024k tokens
8.2× faster to the first token when warm
Cold median
22 s
Warm median
2.65 s

Vital signs

How the traffic behaved

Input read from cache
78.1%
+1.00 pts
Input per output token
46 : 1
+0.30
Output spent thinking
31.5%
−2.40 pts
Turns ending in a tool call
18.5%
−1.60 pts
Median first token
1.41 s
−7.62%
Median stream speed
171 tok/s
+10.15%
Routed by a policy
35.9%
−0.90 pts
Routed by latency
19.0%
−2.60 pts
Week 46

Full rankings

Models · 40Apps · 15Labs · 12Hosts · 20Show
Models by share of tokensTop 40 · Week 46 · Gateway data
Models by share of tokens, each team capped at 2%, this week against last week
RankMoveModelThis weekChange
1=deepseek-v4.1-flashDeepSeek28.3%+2.27 pts
2=claude-opus-5-5Anthropic10.5%+0.28 pts
3=gpt-6-lunaOpenAI8.46%+0.13 pts
4=glm-5.3-flashZ.ai5.42%−0.62 pts
51Up 1 from #6claude-sonnet-5-5Anthropic5.35%+0.08 pts
61Down 1 from #5gpt-6.1-solOpenAI5.04%−0.36 pts
7=deepseek-v4-flashDeepSeek4.57%+0.31 pts
8=claude-haiku-5-5Anthropic3.75%+0.25 pts
91Up 1 from #10nemotron-3-ultra-550b-a55bNVIDIA2.40%+0.03 pts
101Up 1 from #11claude-sonnet-5Anthropic2.18%+0.17 pts
112Up 2 from #13gpt-6.1-terraOpenAI2.16%+0.82 pts
123Down 3 from #9gpt-5.6-lunaOpenAI2.02%−0.37 pts
131Up 1 from #14gemini-3.8-flashGoogle1.45%+0.16 pts
142Down 2 from #12nemotron-3.5-lightning-30b-a3bNVIDIA1.11%−0.41 pts
15=glm-5.3Z.ai0.88%−0.35 pts
16Newgemini-4-carbonGoogle0.73%+0.73 pts
17=claude-opus-5Anthropic0.59%−0.14 pts
181Up 1 from #19claude-sonnet-4-6Anthropic0.58%+0.01 pts
194Up 4 from #23minimax-m3.1-flashMiniMax0.56%+0.05 pts
204Up 4 from #24leanstral-1-5Mistral0.53%+0.03 pts
215Down 5 from #16ling-3.1-flashOther0.52%−0.40 pts
22=gemini-4-argonGoogle0.47%−0.04 pts
235Down 5 from #18deepseek-v4-proDeepSeek0.43%−0.29 pts
243Down 3 from #21gpt-6-solOpenAI0.38%−0.17 pts
255Down 5 from #20gemini-3.5-flash-liteGoogle0.31%−0.25 pts
26=gemini-3.1-flash-liteGoogle0.24%−0.14 pts
271Up 1 from #28gemini-2.5-flash-liteGoogle0.24%−0.01 pts
283Down 3 from #25kimi-k3.1-proMoonshot0.22%−0.22 pts
29Newgemini-4-hydrogenGoogle0.20%+0.20 pts
301Down 1 from #29gemini-3.7-flashGoogle0.19%−0.06 pts
311Up 1 from #32claude-haiku-4-5Anthropic0.14%−0.07 pts
323Up 3 from #35gemma-4-31b-itGoogle0.14%−0.03 pts
331Up 1 from #34gemini-3.1-pro-previewGoogle0.11%−0.08 pts
343Up 3 from #37gemini-2.5-flashGoogle0.10%−0.04 pts
353Up 3 from #38glm-5.2Z.ai0.10%−0.01 pts
36=gpt-5.4OpenAI0.09%−0.07 pts
376Down 6 from #31gpt-5.6-solOpenAI0.09%−0.13 pts
385Down 5 from #33mistral-large-4Mistral0.09%−0.11 pts
391Up 1 from #40gpt-5.5OpenAI0.09%0.00 pts
401Down 1 from #39gemini-3.5-flashGoogle0.08%−0.02 pts
Apps by share of tokensTop 15 · Week 46 · Gateway data
Apps by share of tokens, each team capped at 2%, this week against last week
RankMoveAppThis weekChange
1=OpenAI Python SDKSDK or framework21.3%+2.16 pts
2=OpenCodeCoding agent13.1%−1.00 pts
31Up 1 from #4Vercel AI SDKSDK or framework10.1%+0.77 pts
41Down 1 from #3Claude CodeCoding agent9.83%−1.65 pts
5=PiCoding agent6.64%+3.11 pts
61Up 1 from #7Anthropic SDKSDK or framework2.51%−0.16 pts
71Up 1 from #8OpenAI SDK (other)SDK or framework2.36%−0.13 pts
82Down 2 from #6DeepSeek HarnessCoding agent2.15%−0.54 pts
91Up 1 from #10LiteLLMSDK or framework2.11%+0.21 pts
101Down 1 from #9GitHub CopilotCoding agent1.60%−0.33 pts
11=Kilo CodeCoding agent1.39%+0.12 pts
122Up 2 from #14Zoo CodeCoding agent0.27%+0.09 pts
13=Open WebUIApp0.25%−0.01 pts
142Down 2 from #12LangChainSDK or framework0.21%−0.09 pts
152Up 2 from #17LoreBaryApp0.01%0.00 pts
Labs by share of tokensTop 12 · Week 46 · Gateway data
Labs by share of tokens, each team capped at 2%, this week against last week
RankMoveLabThis weekChange
1=DeepSeek34.1%+2.04 pts
2=Anthropic24.4%+0.50 pts
3=OpenAI19.7%−0.51 pts
4=Z.ai6.62%−1.17 pts
5=Google4.47%+0.37 pts
6=NVIDIA3.59%−0.39 pts
7=MiniMax0.94%−0.15 pts
81Up 1 from #9Mistral0.70%−0.03 pts
91Down 1 from #8Moonshot0.69%−0.17 pts
10=Alibaba0.33%+0.07 pts
11ReXiaomi0.22%−0.73 pts
121Down 1 from #11xAI0.09%−0.05 pts
Hosts by share of tokensTop 20 · Week 46 · Gateway data
Hosts by share of tokens (hosts are not team-capped), this week against last week
RankMoveHostThis weekChange
1=Azure16.3%+0.21 pts
2=Bedrock12.8%+0.05 pts
3=Sference10.4%−1.11 pts
42Up 2 from #6Melious9.69%+3.90 pts
5=DeepInfra7.59%+0.05 pts
62Down 2 from #4Vertex (Claude)7.09%−0.68 pts
71Up 1 from #8Anthropic4.33%+0.18 pts
82Up 2 from #10Vertex (Gemini)4.16%+0.21 pts
92Down 2 from #7OpenAI3.74%−0.86 pts
102Up 2 from #12TensorX3.58%−0.03 pts
112Down 2 from #9DeepSeek3.43%−0.70 pts
121Down 1 from #11NVIDIA3.06%−0.57 pts
133Up 3 from #16Fireworks1.12%+0.30 pts
14=Mistral0.83%−0.31 pts
15=Novita0.57%−0.46 pts
162Up 2 from #18Z.ai0.29%−0.04 pts
173Up 3 from #20Alibaba0.14%−0.01 pts
18ReXiaomi0.14%−0.68 pts
19ReInceptron0.11%+0.02 pts
201Down 1 from #19Moonshot0.10%−0.13 pts

Method

How we count

Week 46 covers Nov 9 to 15, 2026 (UTC), compared with Nov 2 to 8, 2026.

  1. 01Aggregated from the Requesty production gateway for the week (Monday to Sunday, UTC), compared with the week before and the ten weeks before that.
  2. 02We publish shares, rates, ranks and latency only: no volumes, no customer data, no prompt content.
  3. 03In the model, lab and app charts each team counts for at most 2% of a week's tokens, so one heavy team can't bend the chart.
  4. 04An entry is named only when at least 20 teams used it and no single team is more than 60% of it.
  5. 05Latency is measured at the gateway on streaming requests. It includes the host and the network, and reflects the prompts teams sent, not a controlled benchmark.
  6. 06Bring-your-own-key traffic, internal test traffic, synthetic load and abusive accounts are excluded.
Source
model share · scripts/weekly/sql/model_share.sql
Source
app share · scripts/weekly/sql/app_share.sql
Source
lab share · scripts/weekly/sql/lab_share.sql
Source
host share errors · scripts/weekly/sql/host_share_errors.sql
Source
vitals · scripts/weekly/sql/vitals.sql
Source
breadth · scripts/weekly/sql/breadth.sql
Source
request settings · scripts/weekly/sql/request_settings.sql
Source
speed · scripts/weekly/sql/speed.sql
Source
rescues · scripts/weekly/sql/rescues.sql
Source
flow · scripts/weekly/sql/flow.sql
Source
latency dist · scripts/weekly/sql/latency_dist.sql
Source
host race · scripts/weekly/sql/host_race.sql
Source
cache ttft · scripts/weekly/sql/cache_ttft.sql
Source
tools · scripts/weekly/sql/tools.sql
Source
sessions · scripts/weekly/sql/sessions.sql
Source
pulse · scripts/weekly/sql/pulse.sql
Source
host hourly · scripts/weekly/sql/host_hourly.sql

For agents

Read this week as data

# Any week URL returns Markdown when asked for it
curl -H "Accept: text/markdown" \
  https://www.requesty.ai/data/weekly/2026-w46
Ask an AI about this weekChatGPT ↗Claude ↗Perplexity ↗
Source: Requesty, The Gateway Charts, week 46 (Nov 9 to 15, 2026). CC BY 4.0.

Next · Week 47

New charts every Monday