
Traditional latency routing has a blindspot. It picks the provider with the lowest measured P50, sends traffic there, and declares the job done. The problem: that measurement only includes successful requests. A provider that fails 60% of the time still looks fast because the 40% that succeed are quick.
We analyzed 7 days of production traffic for claude-sonnet-4-6 across Anthropic, AWS Bedrock, and Google Vertex in the EU. The results were clear.
The blindspot: speed without reliability
Every hour, a traditional latency router evaluates each provider's P50 time to first token. It picks the lowest one. Simple.
But here is what that "fastest" provider's error rate looks like across 24 hours:
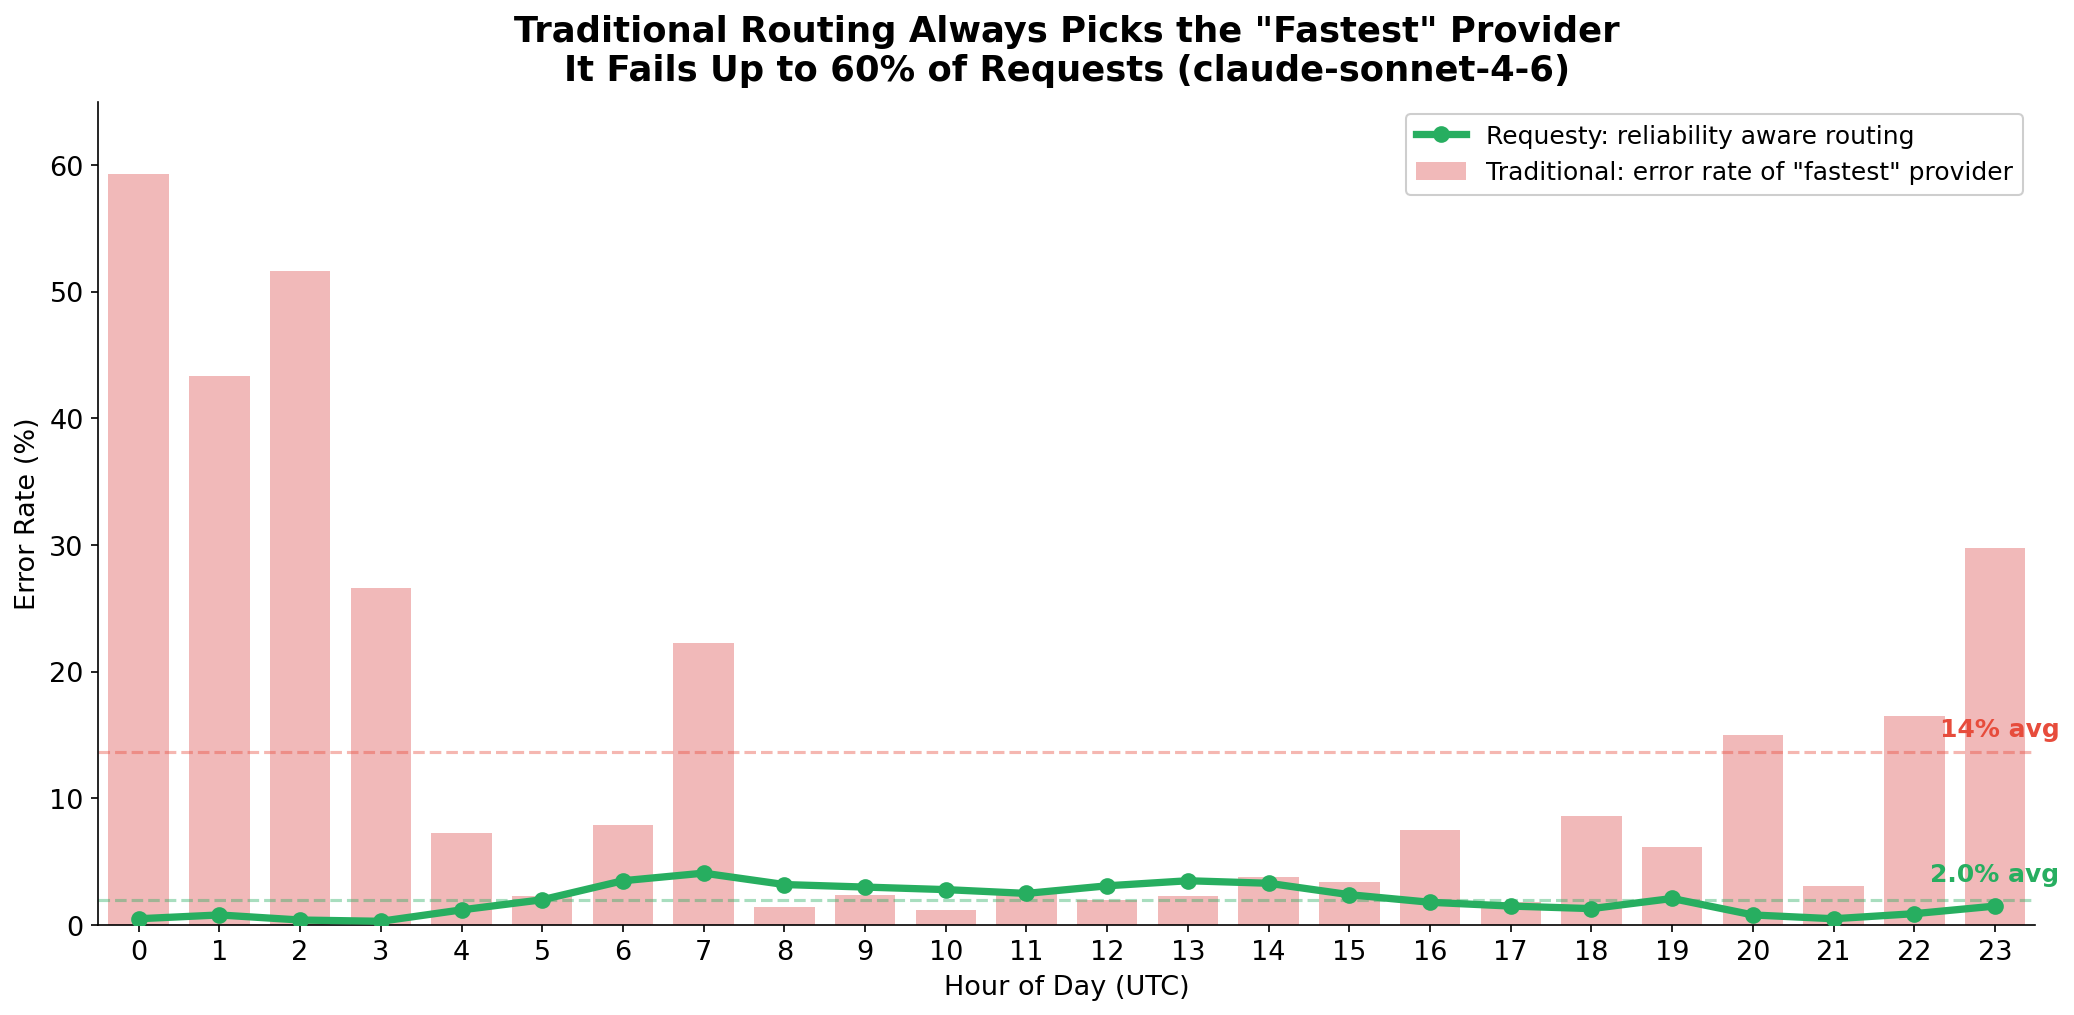
The red bars show the error rate of whichever provider a traditional router would select each hour. At midnight UTC, the "fastest" provider fails 60% of requests. The green line shows what Requesty achieves: a steady 2% average error rate all day.
Traditional routing averages 14% errors. Requesty averages 2%. Same providers, same model, completely different outcome.
Why this happens
The issue is structural. Traditional routers measure latency of successful requests only. A provider returning 429s in 300ms looks "faster" than one succeeding in 2 seconds. The router keeps sending traffic to the failing provider because, from its perspective, it is the fastest option.
Three patterns make this worse:
-
Provider behavior varies by time of day. Bedrock EU fails 60% of requests overnight but recovers to under 3% during business hours. A router that refreshes stats hourly keeps routing there for the entire overnight period.
-
Regions of the same provider behave differently. One Bedrock EU region has 3.6% errors while another has 9.3%, despite serving the same model through the same API.
-
Error spikes are bursty. A provider can go from 2% to 22% errors within 15 minutes. By the time a slow refresh cycle catches it, thousands of requests have failed.
What users experience
When a request fails, the user does not just lose the time spent on the failed attempt. They also pay for retry overhead plus the fallback provider's latency. A failed attempt followed by a retry means 4 seconds of real latency for what should have been a 2 second request.
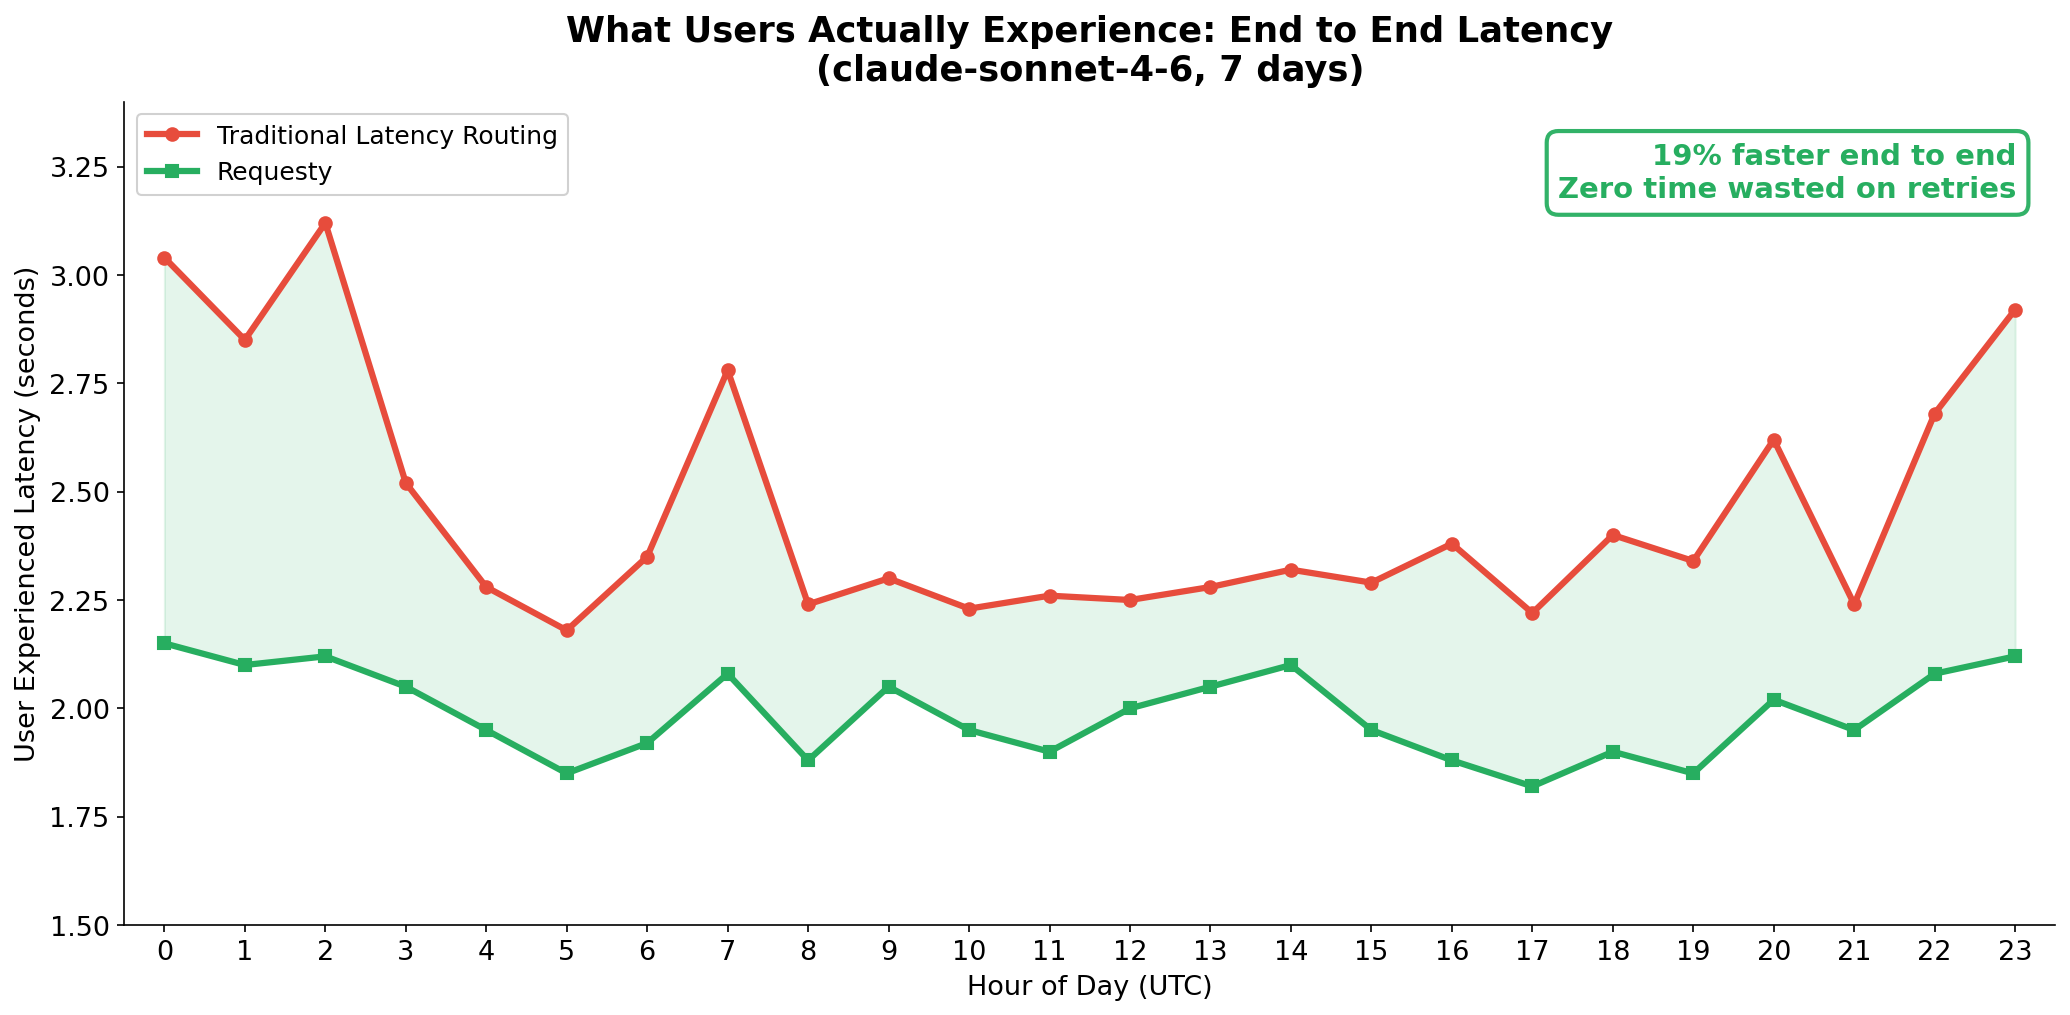
Requesty delivers 19% faster end to end latency. Not because we found a faster provider, but because we stop wasting time on failed attempts. The green shaded area represents time saved every single hour.
One formula, zero parameters
Our approach extends Thompson Sampling with a reliability penalty:
effective_latency = sampled_latency / (1 - error_rate)Every request, we sample from each provider's latency distribution. Before comparing, we divide each sample by the provider's success probability. A provider with high errors sees its effective latency inflated and naturally loses most draws.
The error rate uses a weighted formula:
- Capacity errors (429, 500, 502, 503, 529) count at full weight. These mean the provider is overwhelmed.
- Format errors (400, 422) from the provider count at half weight. Some of these are user caused, so we discount them.
The penalty is capped at 10x to never fully exclude a provider. Thompson Sampling's built in exploration handles the rest: even a heavily penalized provider occasionally wins a draw, allowing the system to detect when it recovers.
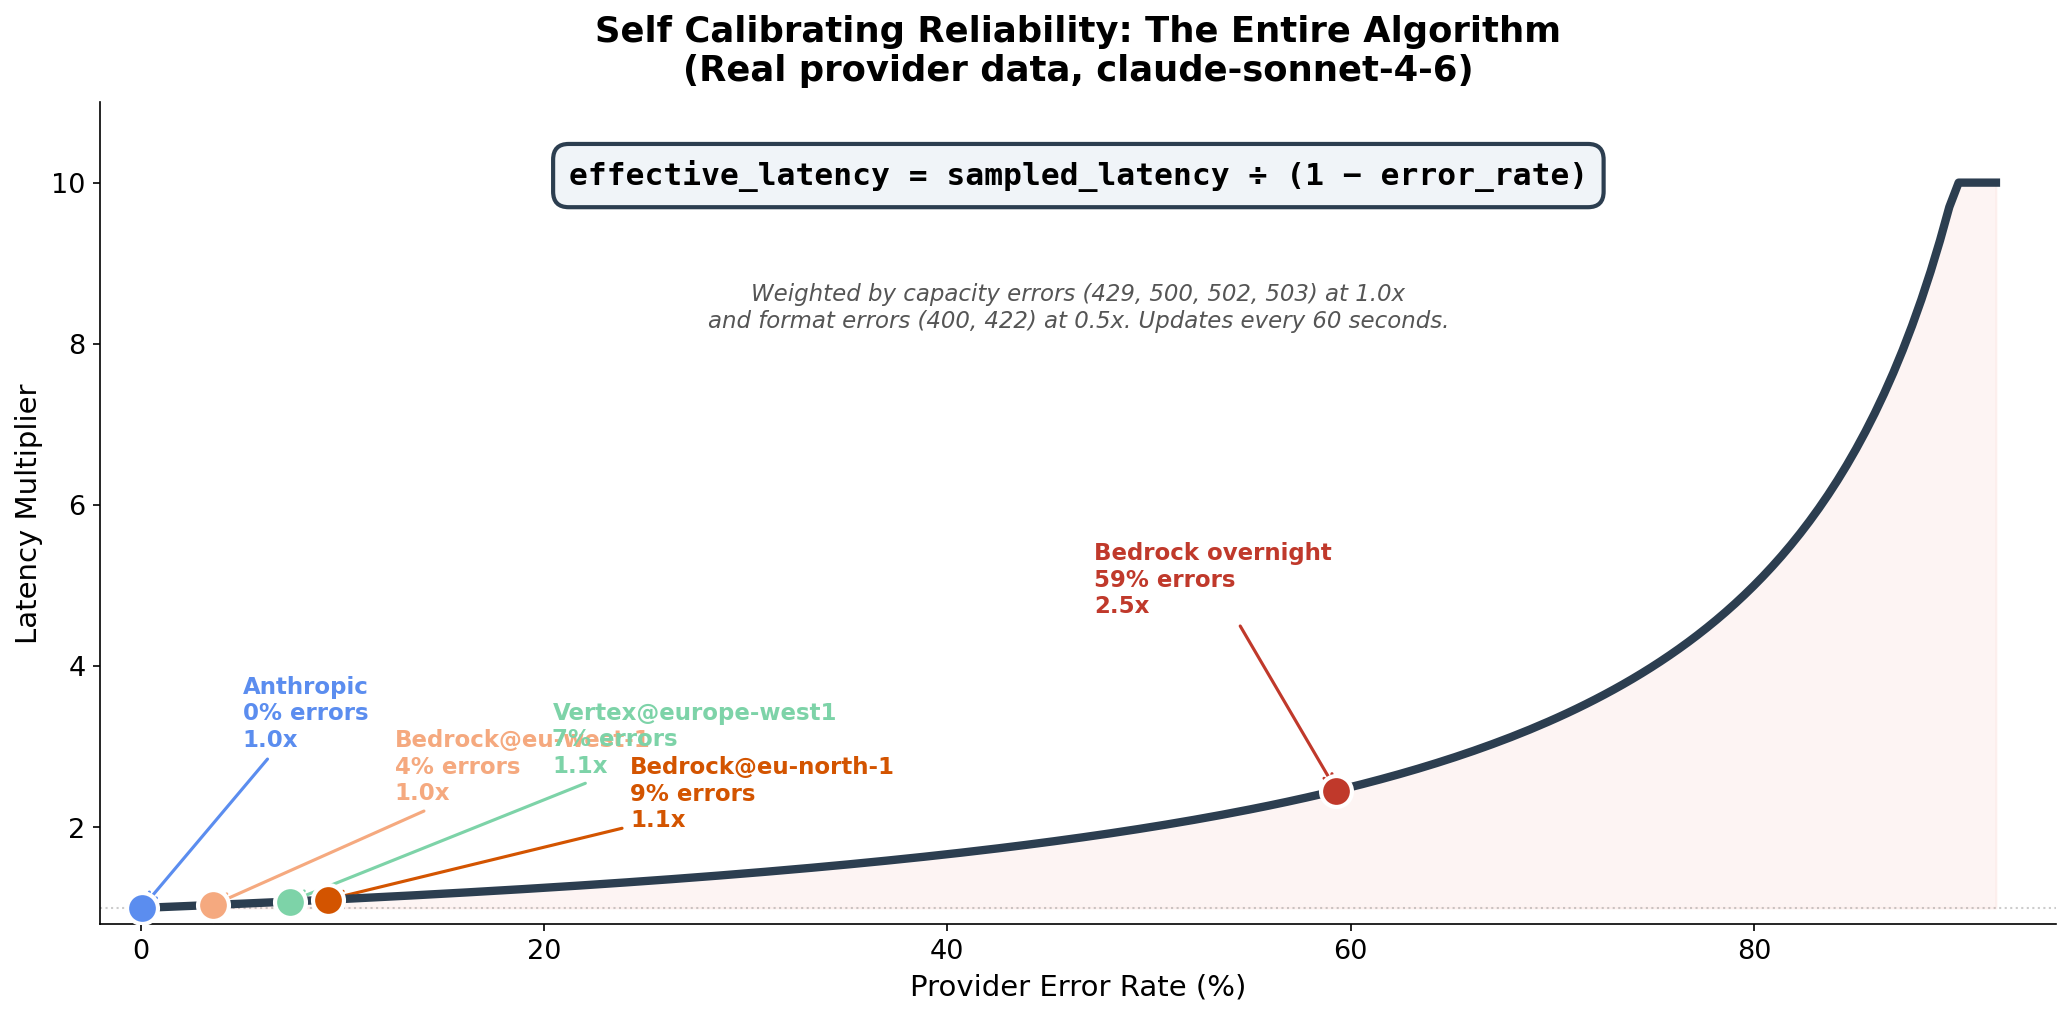
At 0% errors, no penalty. At 7% errors, a mild 1.1x multiplier. At 59% errors, a 2.5x multiplier that effectively removes a provider from selection while still allowing exploration.
The formula is self calibrating:
- Zero parameters to tune. No thresholds to configure. No circuit breaker timeouts to guess.
- Reacts within 60 seconds of a provider degrading.
- Backs off gracefully as the provider recovers.
The full distribution
The improvement shows up across the entire latency distribution, not just the median:
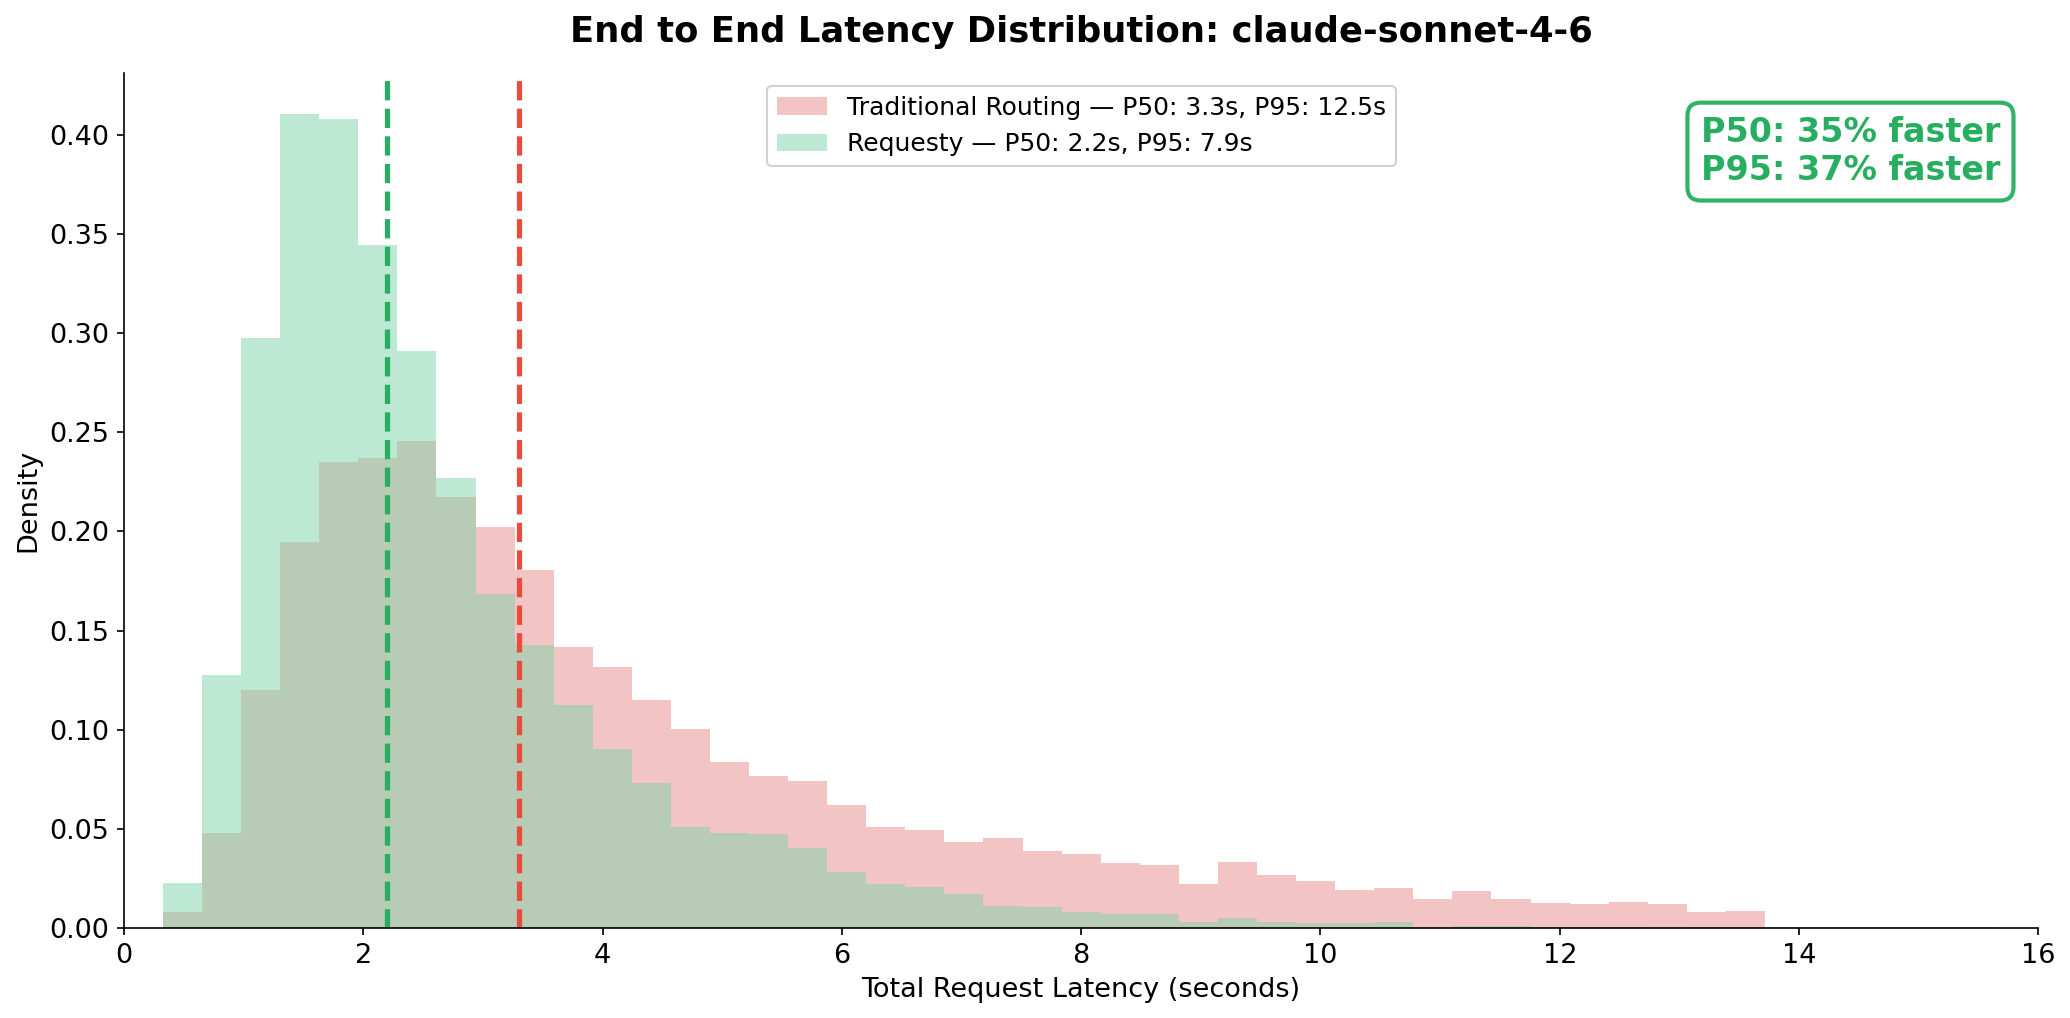
P50: 35% faster. P95: 37% faster. The tail improvement is larger because traditional routing's retry overhead disproportionately affects the worst case.
How Thompson Sampling works with reliability
For readers unfamiliar with Thompson Sampling: each provider has a latency distribution modeled as LogNormal(mean, variance). Every request, we draw one sample from each provider's posterior distribution. The lowest sample wins.
The exploration mechanism is built in. Providers with fewer observations have wider posteriors, so they occasionally draw low values and win traffic. This handles cold start and recovery detection automatically.
Adding the reliability penalty means we divide each sample by the provider's success probability before comparing. A provider with high variance in latency but low errors might still win draws. A provider with low latency but high errors will consistently lose because its samples are inflated.
The result:
- Routes to the fastest reliable provider most of the time
- Shifts traffic automatically as conditions change
- Discovers recovered providers within minutes
- Handles regional differences per provider
- Requires zero configuration
Results on production data
Across 7 days of claude-sonnet-4-6 traffic with 3 providers and 5 EU regions:
| Metric | Traditional | Requesty | Improvement |
|---|---|---|---|
| Average error rate | 14% | 2% | 85% fewer errors |
| P50 latency | 3.3s | 2.2s | 35% faster |
| P95 latency | 12.5s | 7.9s | 37% faster |
The improvements come from two sources: avoiding failed providers and eliminating retry overhead. These compound because every avoided error is also avoided latency.
When traditional routing still works
Pure latency routing without reliability penalty is fine when:
- You are doing cheap classification tasks where a single retry is tolerable
- Your providers have consistent sub-1% error rates
- Cache locality does not matter
For session based workloads, coding agents, or any use case where cache hits matter, reliability aware routing changes everything. A retry to a different provider breaks prefix caching and restarts the context window from scratch.
Try it
Reliability aware routing is available on all Requesty latency policies. No configuration needed. It activates automatically when you use latency based routing. The system adapts to your traffic patterns and the providers you have enabled.
If you are building agents that rely on consistent, fast LLM responses, get started with Requesty and let the routing handle the rest.
Frequently asked questions
- What is reliability aware routing?
- Reliability aware routing extends traditional latency based routing by incorporating provider error rates into the selection decision. Instead of always picking the provider with the lowest P50 latency, the system penalizes unreliable providers so that Thompson Sampling naturally avoids them.
- How does the reliability penalty formula work?
- effective_latency = sampled_latency / (1 - error_rate). A provider with 0% errors gets no penalty. A provider with 50% errors has its effective latency doubled. The penalty is capped at 10x to never fully exclude a provider, allowing Thompson Sampling exploration to detect recovery.
- What error types are penalized?
- Capacity errors (429, 500, 502, 503, 529) are penalized at full weight (1.0x). Format errors (400, 422) from the provider are penalized at half weight (0.5x) because some may be user caused. The weighted error rate is computed over a 15 minute sliding window.
- Does this require any configuration?
- Zero parameters to tune. No circuit breakers. No thresholds. No config files. The formula is entirely self calibrating and updates every 60 seconds using real time error rate data.
- How much does reliability aware routing improve latency?
- On claude-sonnet-4-6 across 3 providers and 5 EU regions over 7 days: P50 improved by 35% and P95 improved by 37%. Error rates dropped from 14% average to 2% average.
- APR '26
Agentic routing, benchmarked: Requesty adds 16ms of overhead, OpenRouter adds 55ms
Agentic routing is the decision layer inside a multi-agent LLM system that picks which model or sub-agent handles an incoming request. Here's what it does, what it costs, and how the gateways compare.
- JAN '26
Designing fallback retries: why Requesty uses 500ms → 4s with jitter
A look at the retry schedule behind Requesty's fallback policies, why exponential backoff with jitter beats a tight retry loop, and the failure modes it actually protects against.
- OCT '25
AI Agent Reliability: Why It Matters and How to Get It Right